Cable Testing with the FrameScope 350 | 3 |
Viewing Result Details
boundary on passing test plots. On failing test plots, the Worst Margin button places the line at the frequency where the results exceed the acceptable limits the most. You can move the cursor around the plot screen by pressing the area you want to see and then using the scroll rocker to fine tune the location. The frequency of the cursor is displayed and the values in the table correspond to the cursor location.
A chart below the plot shows detail results of the current location of the cursor at the FrameScope and DualRemote, and the limits for the test parameter, as follows:
Data: This is the worst case of the test results at the cursor location.
Limit: The limit of passing results, set when the test standard is chosen at the cursor location.
Margin: The difference between the Data value and the Limit value at the cursor location.
The plots are color coded for different wire pairs. The plot lines displayed can be changed by pressing Settings and selecting All Plots, All Local Plots, All Remote Plots, Worst Case Plot, or Select Single Plot. You can also choose to show plots to 100 MHz, 250 MHz, or 350 MHz ,as long as the test was run to the frequency selected. For example, if the test was run to 250 MHz, you could not see plots to 350 MHz. See “Setting the Maximum Frequency” on page 132.
Locator Screens
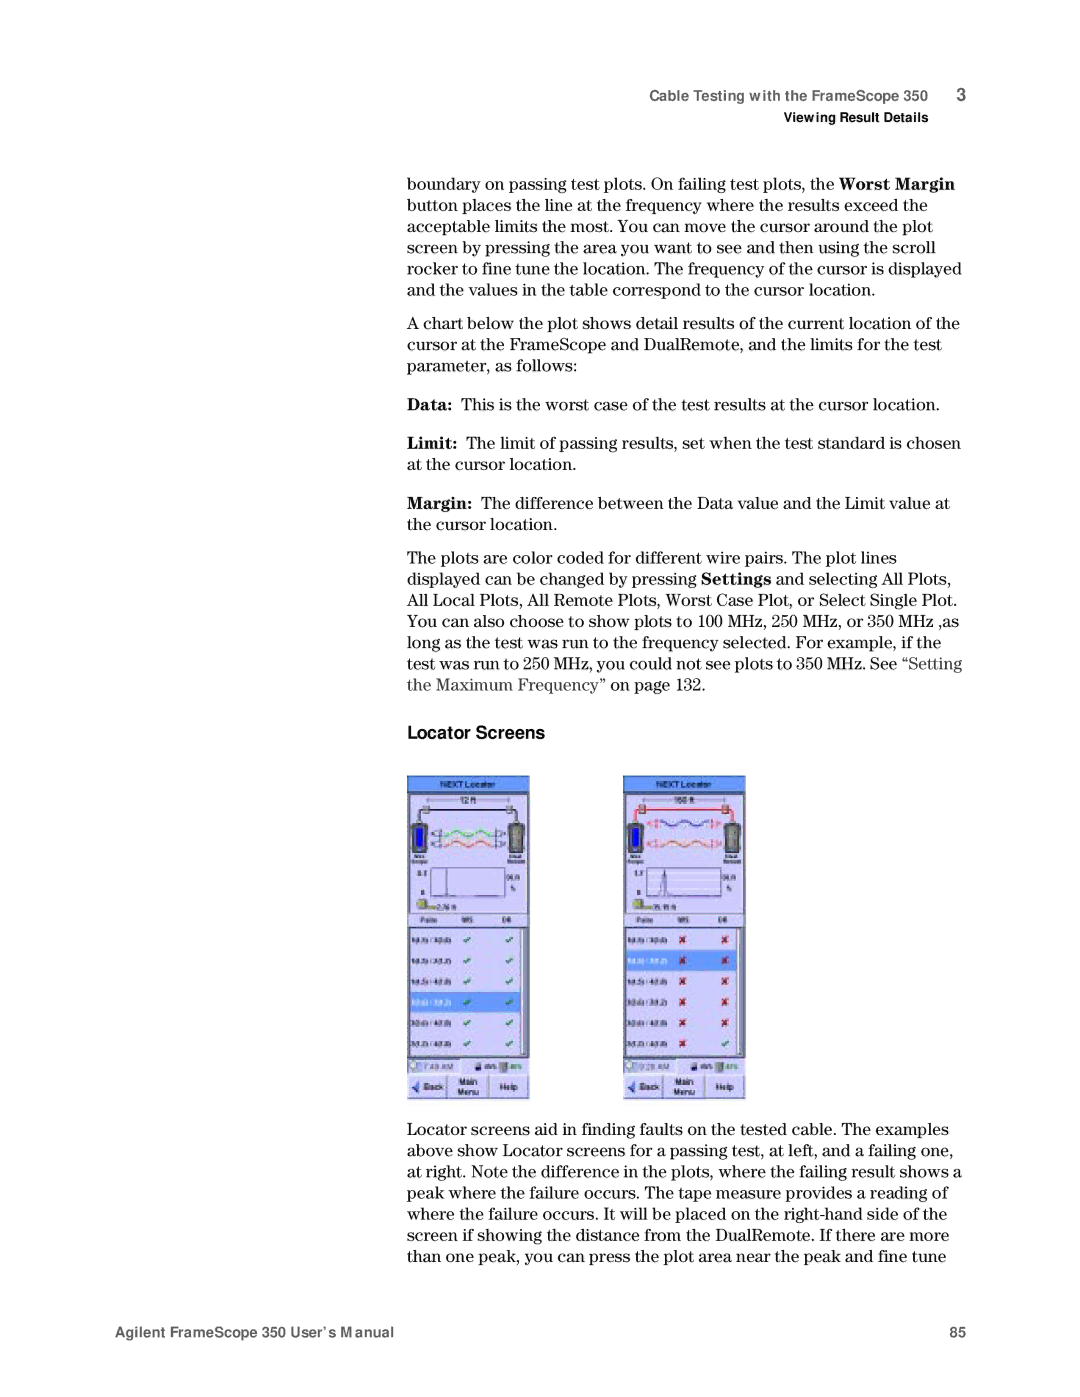
Locator screens aid in finding faults on the tested cable. The examples above show Locator screens for a passing test, at left, and a failing one, at right. Note the difference in the plots, where the failing result shows a peak where the failure occurs. The tape measure provides a reading of where the failure occurs. It will be placed on the
Agilent FrameScope 350 User’s Manual | 85 |
