Standard Operations
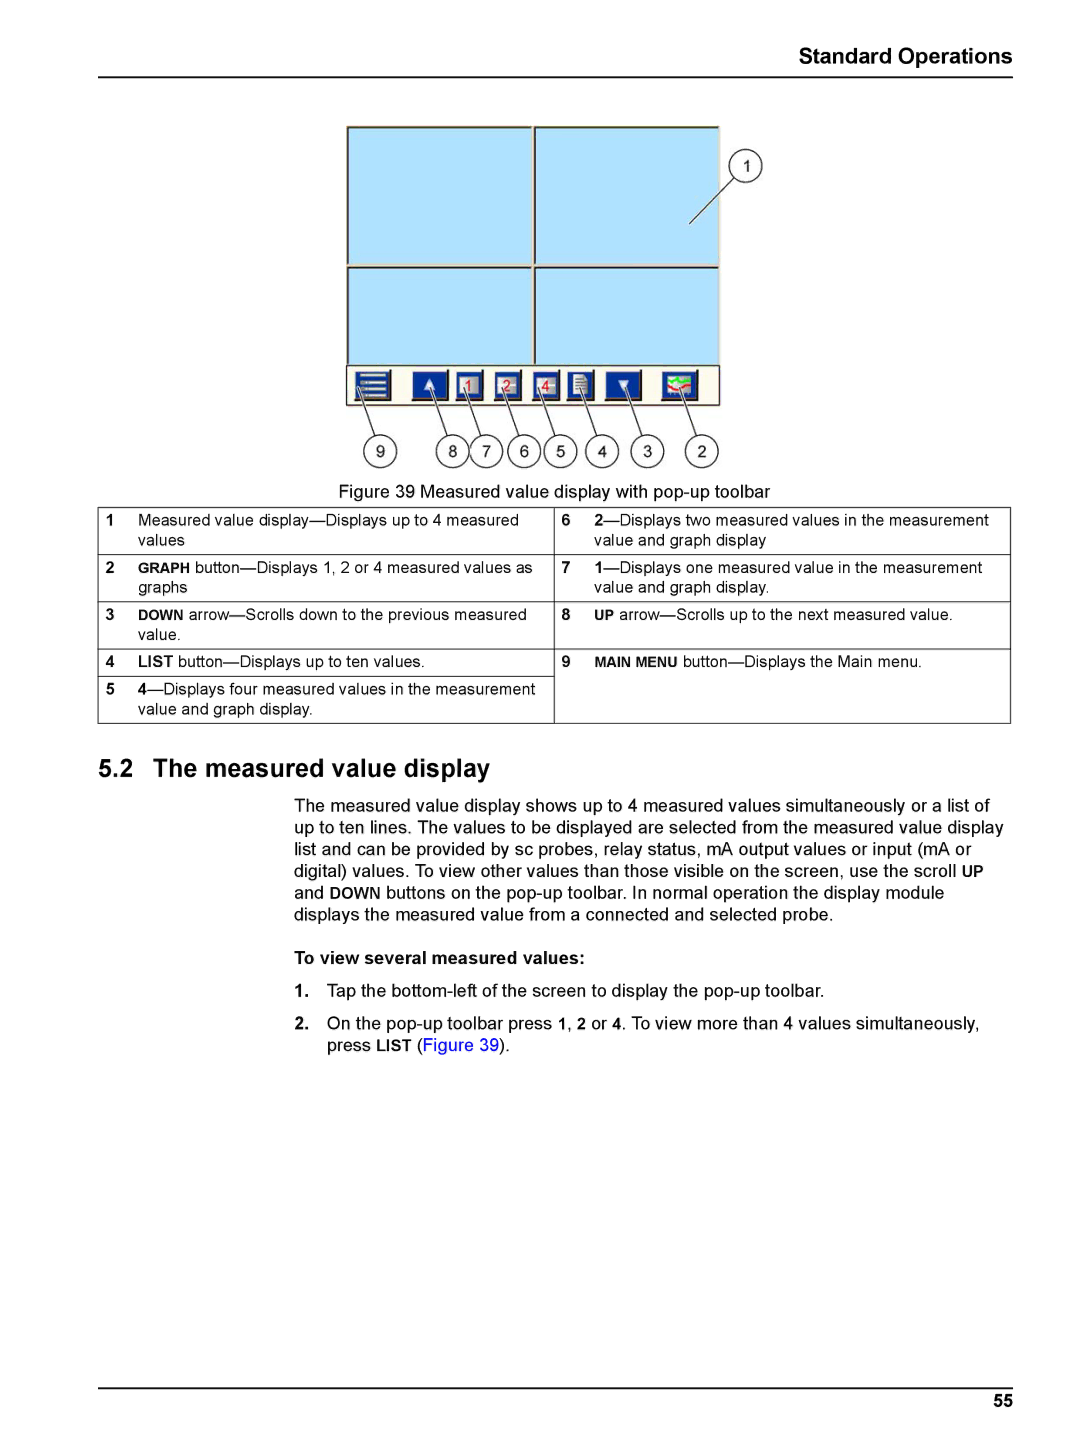
Figure 39 Measured value display with pop-up toolbar
1 | Measured value | 6 | |
| values |
| value and graph display |
|
|
|
|
2 | GRAPH | 7 | |
| graphs |
| value and graph display. |
|
|
|
|
3 | DOWN | 8 | UP |
| value. |
|
|
|
|
|
|
4 | LIST | 9 | MAIN MENU |
|
|
|
|
5 |
|
| |
| value and graph display. |
|
|
5.2 The measured value display
The measured value display shows up to 4 measured values simultaneously or a list of up to ten lines. The values to be displayed are selected from the measured value display list and can be provided by sc probes, relay status, mA output values or input (mA or digital) values. To view other values than those visible on the screen, use the scroll UP and DOWN buttons on the
To view several measured values:
1.Tap the
2.On the
55
