Standard Operations
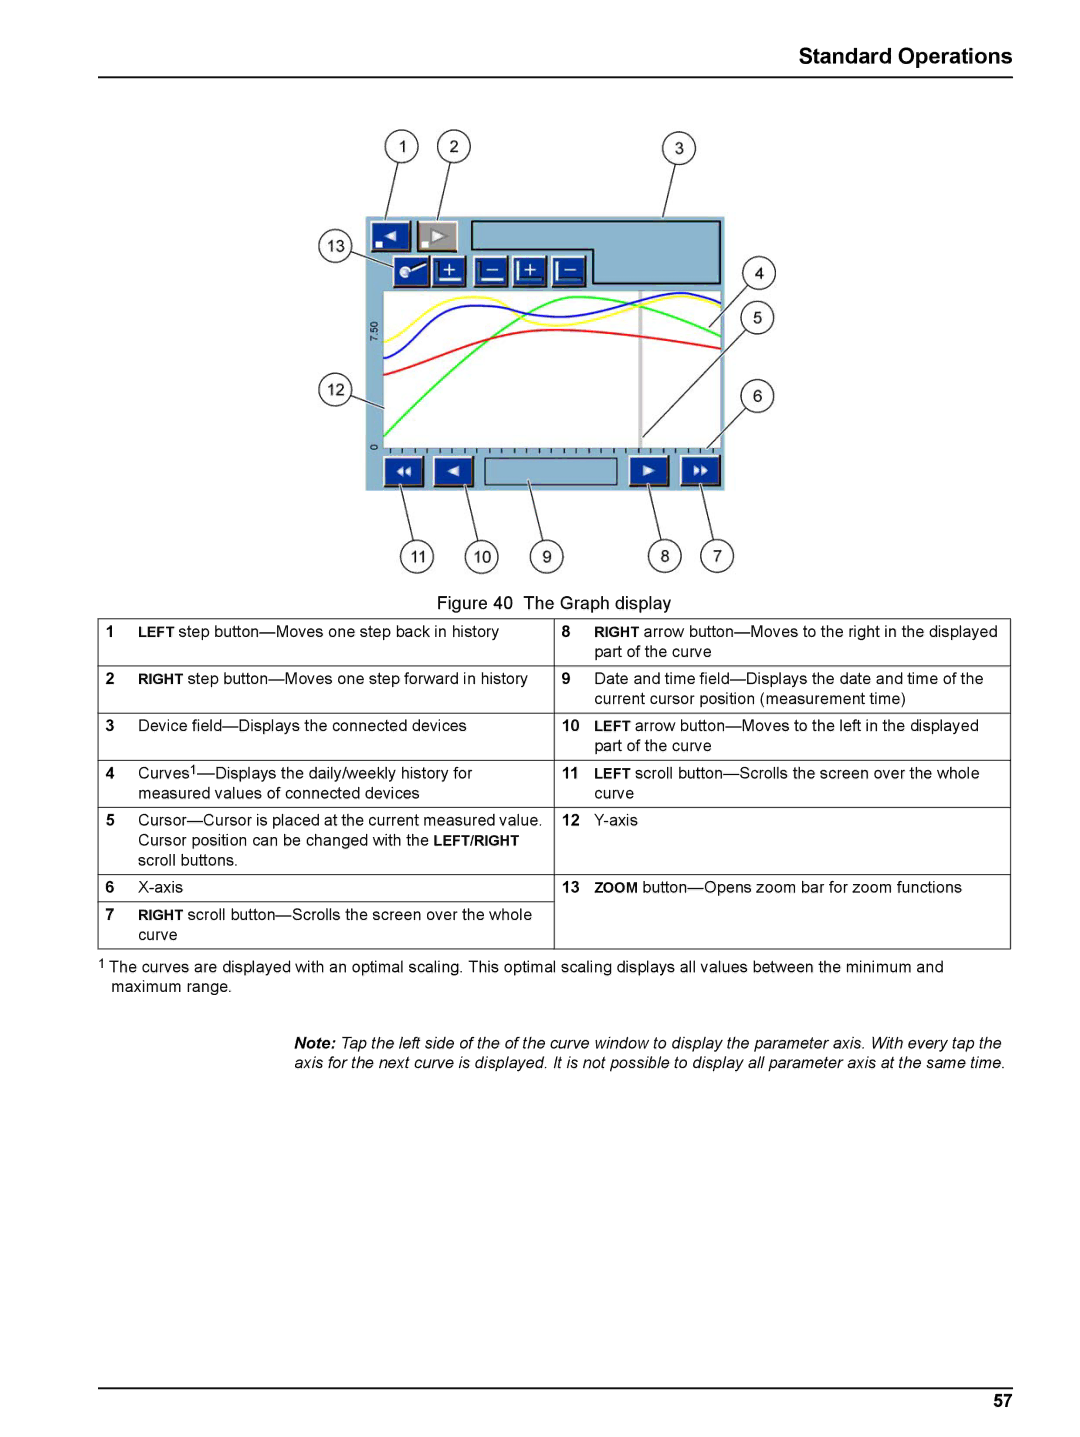
Figure 40 The Graph display
1 | LEFT step | 8 | RIGHT arrow |
|
|
| part of the curve |
|
|
|
|
2 | RIGHT step | 9 | Date and time |
|
|
| current cursor position (measurement time) |
|
|
|
|
3 | Device | 10 | LEFT arrow |
|
|
| part of the curve |
4 | 11 | LEFT scroll | |
| measured values of connected devices |
| curve |
|
|
|
|
5 | 12 | ||
| Cursor position can be changed with the LEFT/RIGHT |
|
|
| scroll buttons. |
|
|
6 | 13 | ZOOM | |
|
|
|
|
7 | RIGHT scroll |
|
|
| curve |
|
|
|
|
|
|
1The curves are displayed with an optimal scaling. This optimal scaling displays all values between the minimum and maximum range.
Note: Tap the left side of the of the curve window to display the parameter axis. With every tap the axis for the next curve is displayed. It is not possible to display all parameter axis at the same time.
57