Chapter 7 - Diagnostics and General Troubleshooting
Diagnostic Screens
You can view network statistics and perform diagnostic tests from the
V500 system’s Diagnostics screens.
To access the Diagnostics screens on the system:
>> Go to System > Diagnostics.
To access the Diagnostics screens from the V500 web interface:
1.On a PC, open a web browser.
2.In the browser address line, enter the system’s IP address (for example, http://255.255.255.255) to go to the V500 web interface.
3.Enter admin as the user name, and the password, if a password has been established.
4.Go to System Setup > Diagnostics.
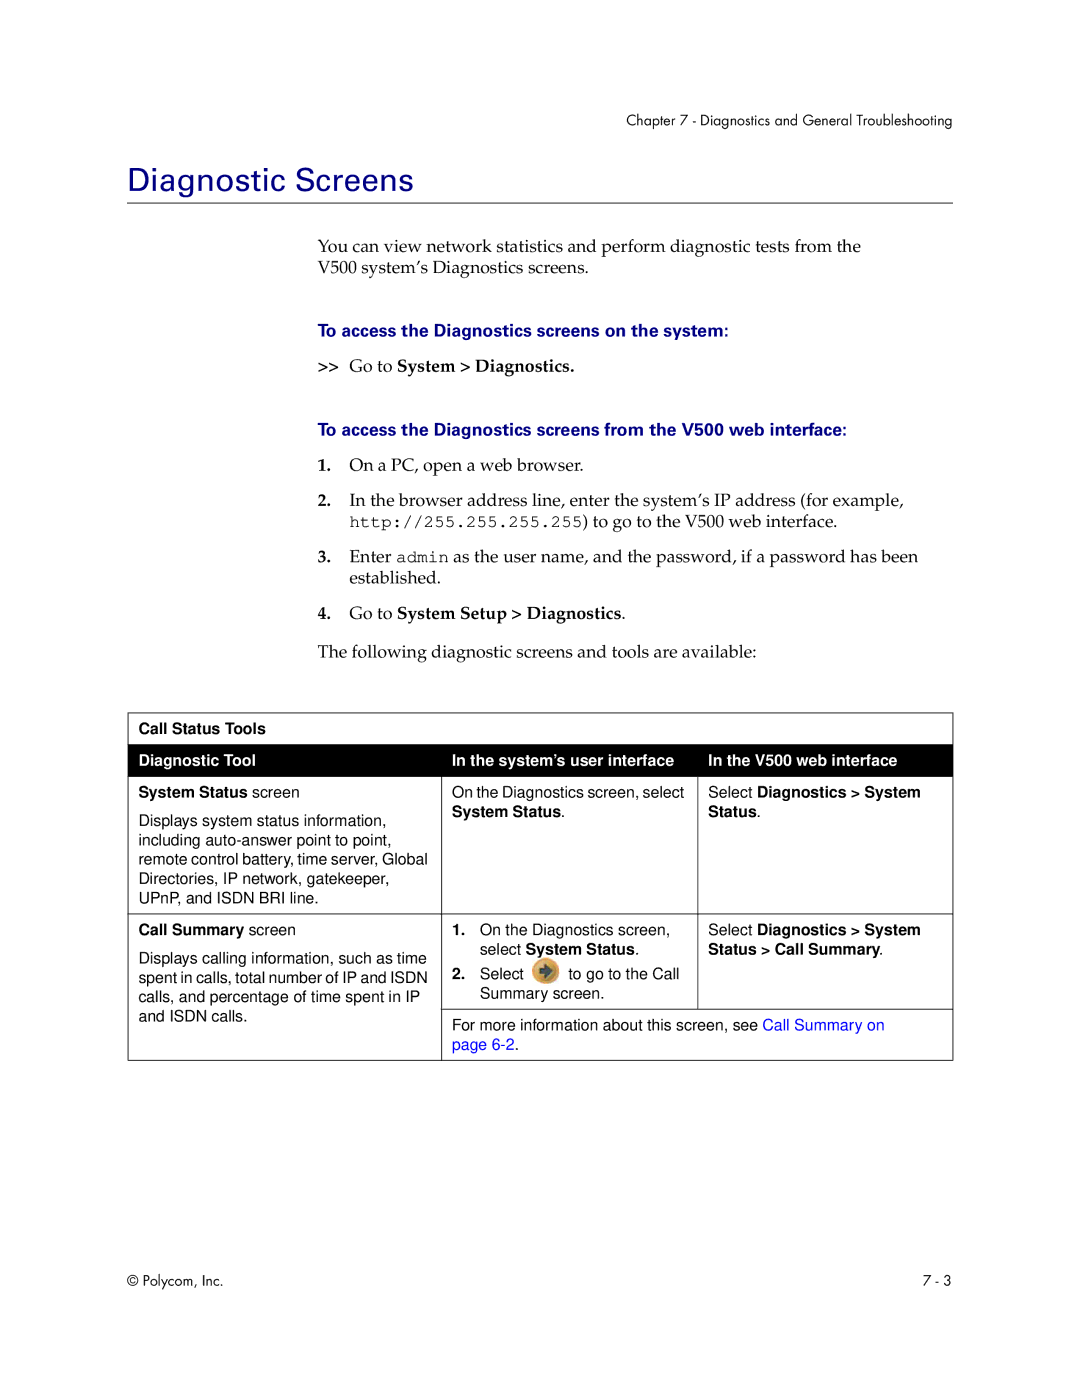
The following diagnostic screens and tools are available:
Call Status Tools
Diagnostic Tool | In the system’s user interface | In the V500 web interface | ||
|
|
| ||
System Status screen | On the Diagnostics screen, select | Select Diagnostics > System | ||
Displays system status information, | System Status. |
| Status. | |
|
|
| ||
including |
|
|
| |
remote control battery, time server, Global |
|
|
| |
Directories, IP network, gatekeeper, |
|
|
| |
UPnP, and ISDN BRI line. |
|
|
| |
|
|
| ||
Call Summary screen | 1. On the Diagnostics screen, | Select Diagnostics > System | ||
Displays calling information, such as time | select System Status. | Status > Call Summary. | ||
2. Select | to go to the Call |
| ||
spent in calls, total number of IP and ISDN |
| |||
calls, and percentage of time spent in IP | Summary screen. |
| ||
and ISDN calls. |
|
|
| |
For more information about this screen, see Call Summary on | ||||
| ||||
| page |
|
| |
|
|
|
| |
© Polycom, Inc. | 7 - 3 |
