NETGEAR, Inc
Trademarks
Statement of Conditions
EU Regulatory Compliance Statement
Bestätigung des Herstellers/Importeurs
Voluntary Control Council for Interference Vcci Statement
Additional Copyrights
AES
Terms
MD5
Product and Publication Details
Model Number
Publication Date January Product Family
Product Name
V1.0, January
Contents
Chapter Manually Configuring Internet and WAN Settings
Dual-WAN Port Models Only
Chapter LAN Configuration
Chapter Content Filtering and Optimizing Scans
Chapter Virtual Private Networking Using SSL Connections
Features That Reduce Traffic
Features That Increase Traffic
Using QoS and Bandwidth Assignment to Shift the Traffic Mix
Changing Passwords and Administrator Settings
Configuring Date and Time Service
Configuring Logging, Alerts, and Event Notifications
Configuring the E-mail Notification Server
Configuring and Activating System, E-mail, and Syslog Logs
Troubleshooting the ISP Connection
Troubleshooting a TCP/IP Network Using a Ping Utility
Testing the LAN Path to Your UTM
Testing the Path from Your PC to a Remote Device
Appendix D Two Factor Authentication
Xvi
About This Manual
Conventions, Formats, and Scope
How to Print This Manual
Revision History
Part Number Version Date Description
Chapter Introduction
Key Features and Capabilities
Advanced VPN Support for Both IPsec and SSL
Powerful, True Firewall
Stream Scanning for Content Filtering
Security Features
Autosensing Ethernet Connections with Auto Uplink
Easy Installation and Management
Extensive Protocol Support
Maintenance and Support
Model Comparison
Differences Between the UTM Models
Service Registration Card with License Keys
Deployment
Package Contents
Hardware Features
Front Panel
LED Descriptions
Object Activity Description
LAN Ports
DMZ LED
Security lock Console port Reset button AC power Receptacle
Rear Panel
Bottom Panel With Product Label
Receptacle
4shows the product label for the UTM5
Choosing a Location for the UTM
6shows the product label for the UTM25
Using the Rack-Mounting Kit
V1.0, January
Using the Setup Wizard to Provision the UTM in Your Network
Understanding the Steps for Initial Connection
Logging In to the UTM
Qualified Web Browsers
V1.0, January
V1.0, January
Understanding the Web Management Interface Menu Layout
V1.0, January
Using the Setup Wizard to Perform the Initial Configuration
Setup Wizard of 10 LAN Settings
Setup Wizard LAN Settings
Dhcp
Setting Description or Subfield and Description
Setup Wizard of 10 WAN Settings
Setting Description or Subfield and Description DNS Proxy
Setup Wizard WAN Settings
Setting Description or Subfield and Description ISP Login
ISP Type
Internet IP Address
ISP
Domain Name Server DNS Servers
Get Automatically from ISP radio button
Setup Wizard of 10 System Date and Time
Setup Wizard System Date and Time Settings
Adjust for Daylight Savings Time checkbox
Setup Wizard of 10 Services
Setup Wizard Services Settings
Web
Instant Messaging
Peer-to-Peer P2P
Setup Wizard of 10 Email Security
Setup Wizard Email Security Settings
Setting Description or Subfield and Description Action
Setup Wizard of 10 Web Security
Scan Exceptions
Setup Wizard Web Security Settings
See Performance Management on
Setup Wizard of 10 Web Categories to Be Blocked
Setup Wizard Content Filtering Settings
Blocked Categories Scheduled Days
Blocked Categories Time of Day
Setup Wizard of 10 Email Notification
Setup Wizard Administrator Email Notification Settings
Administrator Email Notification Settings
Setup Wizard of 10 Signatures & Engine
Setup Wizard of 10 Saving the Configuration
Setup Wizard Signatures & Engine Settings
Update Settings
Update Frequency
Verifying Proper Installation
Testing Connectivity
Testing Http Scanning
Registering the UTM with Netgear
Click Register
What to Do Next
Manually Configuring Internet and WAN Settings
Understanding the Internet and WAN Configuration Tasks
Configuring the Internet Connections
Automatically Detecting and Connecting
V1.0, January
Internet connection methods
Connection Method Data Required
Pptp
Setting the UTM’s MAC Address
Manually Configuring the Internet Connection
V1.0, January
Pptp and PPPoE Settings
Internet IP Address Settings
DNS Server Settings
Network Address Translation All Models
Configuring Auto-Rollover Mode Dual-WAN Port Models Only
Classical Routing All Models
Auto-Rollover Mode Settings Dual-WAN Port Models Only
Setting Description or Subfield and Description Port Mode
Configuring the Internet Connections on
WAN1
WAN2
V1.0, January
Protocol Binding Settings Dual-WAN Port Models Only
Using the Services menu see Services-Based Rules on
Destination
Configuring Secondary WAN Addresses
V1.0, January
Configuring Dynamic DNS
Select Network Config Dynamic DNS from the menu
V1.0, January
DNS Service Settings
WAN2 Dynamic DNS Status
Configuring Advanced WAN Options
Advanced WAN Settings
Setting Description or Subfield and Description MTU Size
Use Default Address radio button
Port Speed
Additional WAN-Related Configuration Tasks
Upload/Download Settings
Chapter LAN Configuration
Managing Virtual LANs and Dhcp Options
Managing the UTM’s Port-Based VLANs
V1.0, January
Vlan Dhcp Options
Dhcp Server
Dhcp Relay
DNS Proxy
Configuring a Vlan Profile
Ldap Server
V1.0, January
Vlan Profile Settings
Vlan ID
Port Membership
Vlan
Enable Dhcp Starting IP
Inter Vlan Routing
Configuring Multi-Home LAN IPs on the Default Vlan
Managing Groups and Hosts LAN Groups
Managing the Network Database
V1.0, January
Add Known PCs and Devices Settings
Setting Up Address Reservation on
Adding PCs or Devices to the Network Database
Changing Group Names in the Network Database
Editing PCs or Devices in the Network Database
Setting Up Address Reservation
Configuring and Enabling the DMZ Port
V1.0, January
DMZ Setup Settings
Own LAN IP address as the primary DNS server IP address
Managing Routing
Configuring Static Routes
Configuring Routing Information Protocol RIP
Static Route Settings
Select Network Configuration Routing from the menu
RIP Configuration Settings
Authentication for RIP-2B/2M
Out Only .
Static Route Example
V1.0, January
Chapter Firewall Protection
About Firewall Protection
Administrator Tips
Using Rules to Block or Allow Specific Kinds of Traffic
Services-Based Rules
Number of Supported Firewall Rule Configurations
Outbound Rules Service Blocking
Customized Services on
Outbound Rules Overview
To Block or Allow Specific Traffic on
Hosts LAN Groups on
Inbound Rules Port Forwarding
NAT IP
V1.0, January
Inbound Rules Overview
Hosts LAN Groups on
Useful when debugging your rules
Order of Precedence for Rules
Setting LAN WAN Rules
LAN WAN Outbound Services Rules
LAN WAN Inbound Services Rules
Setting DMZ WAN Rules
V1.0, January
DMZ WAN Outbound Services Rules
DMZ WAN Inbound Services Rules
Setting LAN DMZ Rules
LAN DMZ Outbound Services Rules
LAN DMZ Inbound Services Rules
Inbound Rules Examples
LAN WAN Inbound Rule Hosting a Local Public Web Server
V1.0, January
V1.0, January
LAN WAN or DMZ WAN Inbound Rule Specifying an Exposed Host
Outbound Rules Example
LAN WAN Outbound Rule Blocking Instant Messenger
Configuring Other Firewall Features
Attack Checks
Attack Checks Settings
VPN Pass through
L2TP
Setting Session Limits
Session Limit Settings
Session Timeout
Managing the Application Level Gateway for SIP Sessions
Creating Services, QoS Profiles, and Bandwidth Profiles
Adding Customized Services
V1.0, January
Services Settings
TCP
Creating Quality of Service QoS Profiles
V1.0, January
QoS Profile Settings
Default High Medium High Low
Creating Bandwidth Profiles
V1.0, January
Bandwidth Profile Settings
Setting a Schedule to Block or Allow Specific Traffic
Enabling Source MAC Filtering
V1.0, January
Setting up IP/MAC Bindings
IP/MAC Binding Settings
Event Notifications on
IP/MAC Bindings
Configuring Port Triggering
V1.0, January
10. Port Triggering Settings
Using the Intrusion Prevention System
V1.0, January
V1.0, January
11. IPS Less Familiar Attack Names
Attack Name Description or Subfield and Description Web
Misc
Content Filtering and Optimizing Scans
About Content Filtering and Scans
Default E-mail and Web Scan Settings
Default E-mail and Web Scan Settings
Configuring E-mail Protection
Scan Type Default Scan Setting Default Action if applicable
Customizing E-mail Protocol Scan Settings
Customizing E-mail Anti-Virus and Notification Settings
E-mail Anti-Virus and Notification Settings
Notification Settings
Performance see Performance Management on
Email Alert Settings
Mail
Mail Content Filtering
TIME%, %PROTOCOL%, %FROM%, %TO%, %SUBJECT%
FILENAME%, %ACTION%, %VIRUSNAME%
V1.0, January
E-mail Filter Settings
Filter by Password-Protected Attachments ZIP, RAR, etc
Password-Protected Attachments ZIP, RAR, etc. section above
Protecting Against E-mail Spam
Filter by File Name
Protected Attachments ZIP, RAR, etc. section above
Setting Up the Whitelist and Blacklist
V1.0, January
Configuring the Real-time Blacklist
Whitelist/Blacklist Settings
V1.0, January
Configuring Distributed Spam Analysis
Distributed Spam Analysis Settings
Anti-Spam Engine Settings
Low Medium-Low
Block spam email
Configuring Web and Services Protection
Customizing Web Protocol Scan Settings and Services
Web Protocol, Instant Messaging, and Peer-to-Peer Settings
Setting Description or Subfield and Description Web
Configuring Web Malware Scans
Malware Scan Settings
Configuring Web Content Filtering
Html Scan
V1.0, January
Content Filtering, screen 1
10 Content Filtering, screen 2
11 Content Filtering, screen 3
Content Filtering Settings
Performance Management on
Full-Text Search
Block Web Objects
Blocked Categories Scheduled Days
Configuring Web URL Filtering
URL
Netgear
V1.0, January
URL Filtering Settings
Setting Description or Subfield and Description Whitelist
Blacklist
URL%
Https Scan Settings
V1.0, January
V1.0, January
10. Https Settings
Specifying Trusted Hosts
V1.0, January
Configuring FTP Scans
11. Trusted Hosts Settings
12. FTP Scan Settings
Setting Web Access Exceptions and Scanning Exclusions
Setting Web Access Exception Rules
Block Files with the Following Extensions
To set Web access exception rules
13. Add and Edit Block Scanning Exception Settings
Groups and Hosts LAN Groups on
Setting Scanning Exclusions
14. Add Scanning Exclusion Settings
V1.0, January
Chapter Virtual Private Networking Using IPsec Connections
UTM
IP Addressing for VPNs in Dual WAN Port Systems
IP Addressing for VPNs in Dual WAN Port Systems
Creating Gateway-to-Gateway VPN Tunnels with the Wizard
V1.0, January
IPsec VPN Wizard Settings for a Gateway-to-Gateway Tunnel
Connection Name and Remote IP Type
Secure Connection Remote Accessibility
Manually Adding or Editing a VPN Policy on
End Point Information a
V1.0, January
Creating a Client to Gateway VPN Tunnel
V1.0, January
IPsec VPN Wizard Settings for a Client-to-Gateway Tunnel
Fqdn
V1.0, January
V1.0, January
Security Policy Editor Remote Party Settings
Only Connect Manually checkbox
Gateway Tunnel
Status on
Security Policy Editor My Identity Settings
On page 7-10. In this example, the domain name is
Testing the Connections and Viewing Status Information
Testing the VPN Connection
Security Policy Editor Security Policy Settings
Detection checkbox
Netgear VPN Client Status and Log Information
V1.0, January
Viewing the UTM IPsec VPN Connection Status
Status Indications for the VPN Client System Tray Icon
System Tray Icon Status
Viewing the UTM IPsec VPN Log
IPsec VPN Connection Status Information
Managing IPsec VPN Policies
Managing IKE Policies
IKE Policies Screen
List of IKE Policies Information
Manually Adding or Editing an IKE Policy
V1.0, January
10. Add IKE Policy Settings
Description or Subfield and Description Mode Config Record
General
Local
Remote
IKE SA Parameters
Configuring
Group 1 768 bit
Group 5 1536 bit
Keepalives and Dead
Screen see User Database Configuration on
Configuration on
Managing VPN Policies
VPN Policies Screen
11. List of VPN Policies Information
Remote
Manually Adding or Editing a VPN Policy
V1.0, January
12. Add VPN Policy Settings
Configuring Keepalives
Description or Subfield and Description General
Dead Peer
Traffic Selection
Manual Policy Parameters
Auto Policy Parameters
Configuring Extended Authentication Xauth
Group 768 bit
Group 1536 bit
Configuring Xauth for VPN Clients
User Database Configuration
Radius Client Configuration
Information, see Radius Client Configuration on
V1.0, January
14. Radius Client Settings
Backup Radius Server
Connection Configuration
Primary Radius Server
Assigning IP Addresses to Remote Users Mode Config
Mode Config Operation
Configuring Mode Config Operation on the UTM
V1.0, January
15. Add Mode Config Record Settings
Description or Subfield and Description Client Pool
Traffic Tunnel Security Level
V1.0, January
16. Add IKE Policy Settings for a Mode Config Configuration
Description or Subfield and Description Remote
Menu, select Group 2 1024 bit
Configuring the ProSafe VPN Client for Mode Config Operation
192.168.1.0 Mask
Gateway Tunnel
18. Security Policy Editor My Identity, Mode Config Settings
Menu
Configuring Keepalives and Dead Peer Detection
Testing the Mode Config Connection
Configuring Keepalives
Configuring Dead Peer Connection
20. Keepalive Settings
21. Dead Peer Detection Settings
Configuring NetBIOS Bridging with IPsec VPN
V1.0, January
Chapter Virtual Private Networking Using SSL Connections
Understanding the SSL VPN Portal Options
Using the SSL VPN Wizard for Client Configurations
SSL VPN Wizard of 6 Portal Settings
SSL VPN Wizard Portal Settings
Portal Layout and Theme Name
Screen as shown in -8 on
SSL VPN Wizard of 6 Domain Settings
SSL VPN Portal Pages to Display
SSL VPN Wizard Domain Settings
Domain Name
Radius Client
SSL VPN Wizard of 6 User Settings
SSL VPN Wizard User Settings
SSL VPN Wizard of 6 Client IP Address Range and Routes
SSL VPN Wizard Client IP Address Range and Routes Settings
Client IP Address Range
Add Routes for VPN Tunnel Clients
SSL VPN Wizard Port Forwarding Settings
SSL VPN Wizard of 6 Port Forwarding
SSH
Add New Host Name for Port Forwarding
SSL VPN Wizard of 6 Verify and Save Your Settings
Accessing the New SSL Portal Login Screen
V1.0, January
Viewing the UTM SSL VPN Connection Status
Viewing the UTM SSL VPN Log
Manually Configuring and Editing SSL Connections
Creating the Portal Layout
V1.0, January
V1.0, January
Add Portal Layout Settings
Revalidate
Configuring Domains, Groups, and Users
Configuring Applications for Port Forwarding
Adding Servers and Port Numbers
Adding a New Host Name
Port Forwarding Applications/TCP Port Numbers
TCP Application Port Number
Configuring the SSL VPN Client
Fully Qualified Domain Name. The full server name
Configuring the Client IP Address Range
Adding Routes for VPN Tunnel Clients
Tunnel Clients on
Using Network Resource Objects to Simplify Policies
Adding New Network Resources
Editing Network Resources to Specify Addresses
Configuring User, Group, and Global Policies
Add Resource Addresses Settings
Viewing Policies
Adding a Policy
10. Add Policy Settings
Policy For
Description or Subfield and Description Add SSL VPN Policies
Network Resource Objects to Simplify Policies on
10. Add Policy Settings
V1.0, January
V1.0, January
Managing Users, Authentication, and Certificates
Configuring VPN Authentication Domains, Groups, and Users
Configuring Domains
Authentication Protocols and Methods
Ldap
Add Domain Settings
Creating the Portal Layout on
Configuring Groups for VPN Policies
Creating and Deleting Groups
VPN Group Settings
Editing Groups
Configuring User Accounts
V1.0, January
Add User Settings
See Configuring Extended Authentication Xauth on
Policies on
Setting User Login Policies
Configuring Login Policies
Configuring Login Restrictions Based on IP Address
Configuring Login Restrictions Based on Web Browser
Add Defined Addresses Settings
Internet Explorer Opera Netscape Navigator
Changing Passwords and Other User Settings
Edit User Settings
Enabled see Configuring Extended Authentication Xauth on
Managing Digital Certificates
V1.0, January
Managing CA Certificates
11 Certificates, screen 1
Managing Self Certificates
Generating a CSR and Obtaining a Self Certificate from a CA
Generate Self Certificate Request Settings
Setting
512 1024 2048
V1.0, January
Managing the Certificate Revocation List
Viewing and Managing Self Certificates
15Certificates, screen 3
Performance Management
Bandwidth Capacity
Features That Reduce Traffic
Network and System Management 10-3
Content Filtering
Features That Increase Traffic
Source MAC Filtering
10-6 Network and System Management
Configuring the DMZ Port
Port Triggering
Using QoS and Bandwidth Assignment to Shift the Traffic Mix
Configuring Exposed Hosts
Configuring VPN Tunnels
Assigning QoS Profiles
Changing Passwords and Administrator Settings
System Management
Monitoring Tools for Traffic Management
Assigning Bandwidth Profiles
10-10 Network and System Management
Network and System Management 10-11
Configuring Remote Management Access
Https//IPaddress or https//FullyQualifiedDomainName
Using an Snmp Manager
Managing the Configuration File
Snmp Settings
Setting Description or Subfield and Description Settings
Trusted Snmp Hosts
Backup Settings
Restore Settings
Reverting to Factory Default Settings
Updating the Firmware
Viewing the Available Firmware Versions
Upgrading the Firmware and Rebooting the UTM
Rebooting Without Changing the Firmware
Updating the Scan Signatures and Scan Engine Firmware
10-22 Network and System Management
Configuring Automatic Update and Frequency Settings
Signatures & Scan Engine Settings
Configuring Date and Time Service
System Date & Time Settings
Network and System Management 10-25
10-26 Network and System Management
Monitoring System Access and Performance
Enabling the WAN Traffic Meter
11-2 Monitoring System Access and Performance
WAN Traffic Meter Settings
Traffic Counter
Logging, Alerts, and Event Notifications on
System, E-mail, and Syslog Logs on
Configuring Logging, Alerts, and Event Notifications
Configuring the E-mail Notification Server
Configuring and Activating System, E-mail, and Syslog Logs
E-mail Notification Settings
Server requires authentication checkbox and enter
Monitoring System Access and Performance 11-7
E-mail and Syslog Settings
Email Logs to Administrator
Send Logs via Syslog
Configuring and Activating Update Failure and Attack Alerts
Alerts Settings
PROTOCOL%, %FROM%, %TO%, %SUBJECT%, %FILENAME%
ACTION%, %VIRUSNAME%
Configuring and Activating Firewall Logs
Firewall Logs Settings
Monitoring Real-Time Traffic, Security, and Statistics
Dashboard, screen 1
Settings on
Spam to configure, see Protecting Against E-mail Spam on
Total Threats
System on
Threats Counts
Total Traffic Bytes
Categories, see Using the Intrusion
Dashboard Most Recent 5 and Top 5 Information
Category Most Recent 5 Description Top 5 Description
Prevention System on
Dashboard Service Statistics Information
Dashboard, screen 3
Viewing Status Screens
Viewing System Status
Setting Status
System Status Status and System Information
11 System Status, screen 2
NAT
LAN Port
Dhcp
Viewing Active VPN Users
Viewing VPN Tunnel Connection Status
11. System Status Interface Statistics
12. IPsec VPN Connection Status Information
To view the status of the Port Triggering feature
Viewing Port Triggering Status
Viewing the WAN Ports Status
13. Port Triggering Status Information
11-28 Monitoring System Access and Performance
Models see Manually Configuring the Internet Connection on
Edit Vlan Profile screen see Configuring a Vlan Profile on
Viewing Attached Devices and the Dhcp Log
Viewing Attached Devices
11-30 Monitoring System Access and Performance
Viewing the Dhcp Log
Querying Logs and Generating Reports
Querying the Logs
Monitoring System Access and Performance 11-33
15. Logs Query Settings
See Configuring and Activating Firewall Logs on
This field is available for the following logs
Following protocols can be selected
Following categories can be selected
Following reasons can be selected
This field is available only for the Spam log
This field is available only for the Malware log
EMERG, ALERT, CRITICAL, ERROR, WARNING, Notice
This field is available only for the Service log
This field is available only for the Content filters log
Example Using Logs to Identify Infected Clients
Log Management
Scheduling and Generating Reports
Generating Reports
16. Generate Report Settings
Email Reports
Web Reports
System Reports
17. Schedule Report Settings
Scheduling Reports
Using Diagnostics Utilities
Email Reports Web Reports System Reports
Report List
Using the Network Diagnostic Tools
Sending a Ping Packet
Tracing a Route
Displaying the Routing Table
Looking up a DNS Address
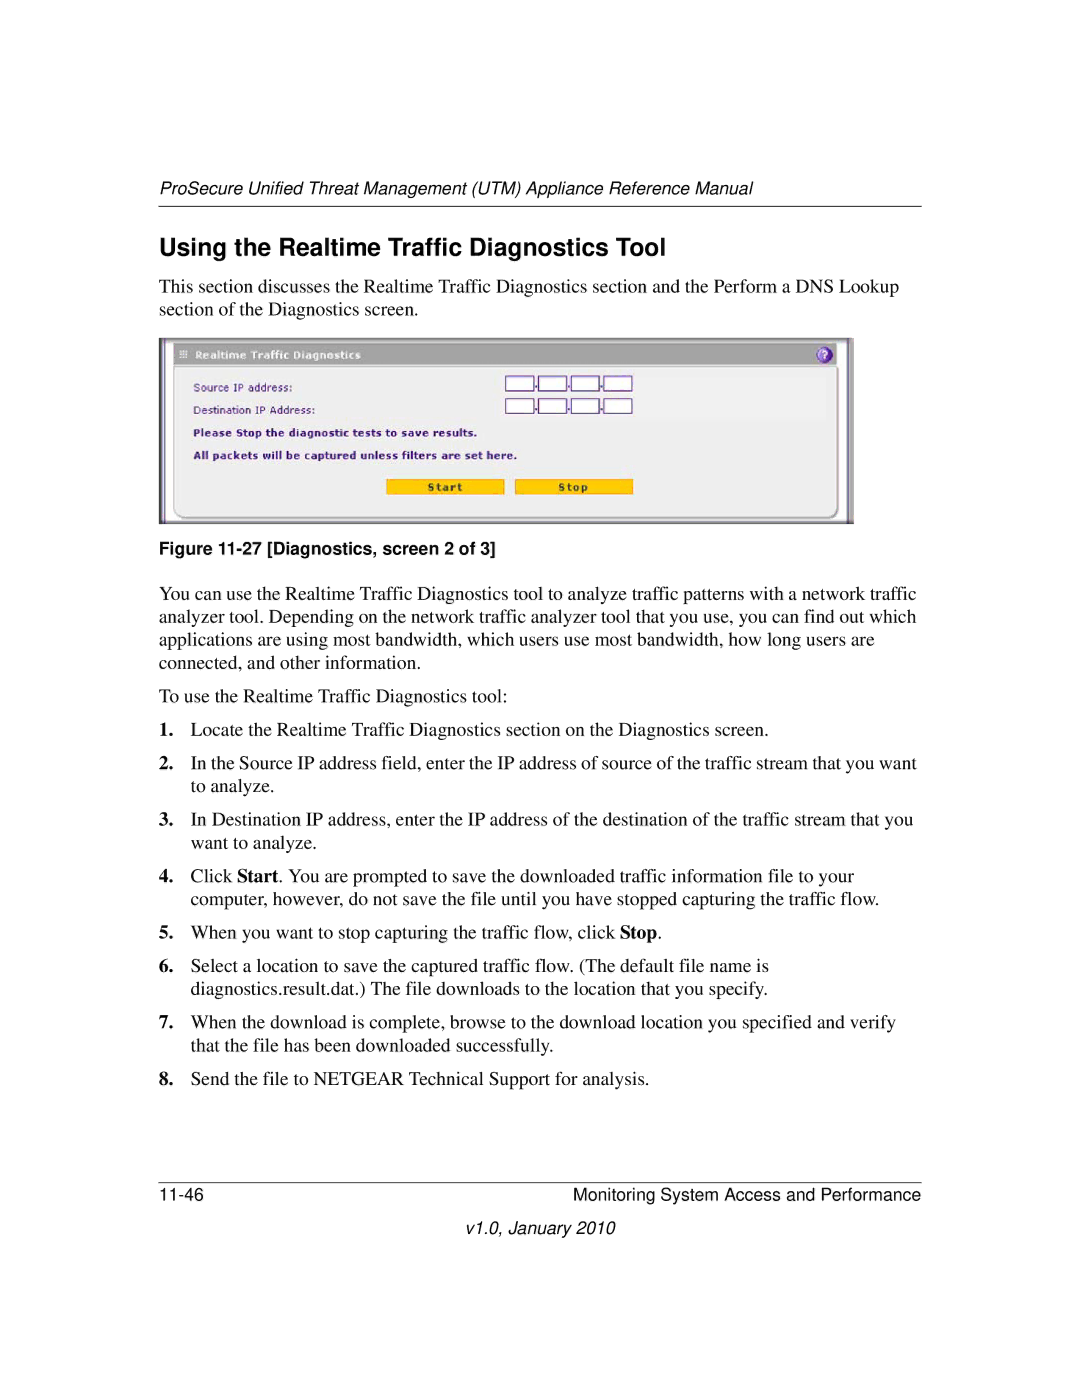
Using the Realtime Traffic Diagnostics Tool
27 Diagnostics, screen 2
Gathering Important Log Information
Generating Network Statistics
Rebooting and Shutting Down the UTM
Troubleshooting and Using Online Support
Power LED Not On
Basic Functioning
Test LED Never Turns Off
Troubleshooting the Web Management Interface
LAN or WAN Port LEDs Not On
When You Enter a URL or IP Address a Time-out Error Occurs
Troubleshooting the ISP Connection
12-6 Troubleshooting and Using Online Support
Troubleshooting a TCP/IP Network Using a Ping Utility
Testing the LAN Path to Your UTM
Testing the Path from Your PC to a Remote Device
Ping -n 10 IP address
Restoring the Default Configuration and Password
Problems with Date and Time
Using Online Support
Enabling Remote Troubleshooting
Sending Suspicious Files to Netgear for Analysis
Accessing the Knowledge Base and Documentation
Malware Analysis Settings
Table A-1. UTM Default Configuration Settings
Feature Default behavior Router Login
Internet Connection
Local Network LAN
Table A-2. UTM Physical and Technical Specifications
Table A-3. UTM IPsec VPN Specifications
Feature Specification Environmental Specifications
Interface Specifications
Setting Specification
Table A-4. UTM SSL VPN Specifications
MD5, SHA-1, MAC-MD5/SHA-1, HMAC-MD5/SHA-1
What to Consider Before You Begin
WAN port Physical facility
Internet
Computer Network Configuration Requirements
Internet Configuration Requirements
Cabling and Computer Hardware Requirements
Where Do I Get The Internet Configuration Information?
Internet Connection Information
Overview of the Planning Process
Figure B-2
Inbound Traffic
Inbound Traffic to a Single WAN Port System
Inbound Traffic to a Dual WAN Port System
Inbound Traffic Dual WAN Ports for Improved Reliability
Inbound Traffic Dual WAN Ports for Load Balancing
Virtual Private Networks VPNs
VPN Road Warrior Client
To-Gateway
To-Gateway Through a NAT
Figure B-7
VPN Road Warrior Client-to-Gateway
VPN Road Warrior Single Gateway WAN Port Reference Case
Figure B-10
VPN Gateway-to-Gateway
VPN Road Warrior Dual Gateway WAN Ports for Load Balancing
Figure B-13
Figure B-15
VPN Telecommuter Client-to-Gateway Through a NAT Router
VPN Telecommuter Single Gateway WAN Port Reference Case
Figure B-18
VPN Telecommuter Dual Gateway WAN Ports for Load Balancing
Figure B-20
Table C-1. Log Message Terms
Term Description or Subfield and Description
Reboot
Table C-3. System Logs Reboot
System Log Messages
System Startup
Service Logs
Table C-4. System Logs Service
Table C-5. System Logs NTP
Login/Logout
Firewall Restart
IPsec Restart
Auto-Rollover Mode
WAN Status
System Logs WAN Status, Auto Rollover
ACTIVEWAN2
Load-Balancing Mode
Table C-9. System Logs WAN Status, Load Balancing
Table C-10. System Logs WAN Status, PPPoE Idle-Timeout
PPP Logs
Table C-11. System Logs WAN Status, Pptp Idle-Timeout
Table C-12. System Logs WAN Status, PPP Authentication
Traffic Metering Logs
Unicast Logs
Icmp Redirect Logs
Invalid Packet Logging
Multicast/Broadcast Logs
Table C-16. System Logs Multicast/Broadcast
Table C-17. System Logs Invalid Packets
Invalidbadchecksumdrop SRC=192.168.20.10
Invalidbadhwchecksumdrop SRC=192.168.20.10
Invalidmalformedpacketdrop SRC=192.168.20.10
Invalidshortpacketdrop SRC=192.168.20.10
Content Filtering and Security Logs
Web Filtering and Content Filtering Logs
Table C-19. Content Filtering and Security Logs Spam
Spam Logs
Table C-20. Content Filtering and Security Logs Traffic
Table C-21. Content Filtering and Security Logs Virus
Traffic Logs
Virus Logs
Table C-23. Content Filtering and Security Logs IPS
Table C-24. Content Filtering and Security Logs Port Scan
IPS Logs
Port Scan Logs
Routing Logs
LAN to WAN Logs
LAN to DMZ Logs
DMZ to WAN Logs
WAN to LAN Logs
DMZ to LAN Logs
WAN to DMZ Logs
V1.0, January
Why do I need Two-Factor Authentication?
What are the benefits of Two-Factor Authentication?
Netgear Two-Factor Authentication Solutions
What is Two-Factor Authentication
Figure D-1
Figure D-3
Appendix E Related Documents
Document Link
V1.0, January
Index
Numerics
Index-2
Index-3
Index-4
Index-5
Index-6
Index-7
Index-8
Index-9
Index-10
Index-11
Index-12
Index-13
Index-14
Index-15
Index-16