Powerware 9390 UPS 100-160 kVA
Important Safety Instructions
Table of Contents
Section II Operation
Features, Options, and Accessories
Responding to System Events
Communication
This page intentionally left blank
Vii
Viii
Introduction
Chapter
Basic System Configurations
Using This Manual
This manual uses these type conventions
Conventions Used in This Manual
N G E R
Safety Warnings
Getting Help
For More Information
Section
This page intentionally left blank
UPS Installation Plan and Unpacking
Creating an Installation Plan
Preparing the Site
Environmental Considerations
Preparing for Wiring the UPS System
Inspecting and Unpacking the UPS Cabinet
Powerware 9390 UPS 100-160 kVA Cabinet as Shipped on Pallet
U T I O N
Installing the UPS System
Preliminary Installation Information
UPS Cabinet Installation
Unloading the Powerware 9390 UPS Cabinet from the Pallet
Front View
Rear View
Battery Cabinet Installation
U T I O N
External Wiring Installation Procedure a
U T I O N
External Wiring Installation Procedure B
Battery Wiring
7.1 TB1 and TB2 Connections
Installing Interface Connections
7.2 TB2 Battery Cabinet Connections
Slot Connections
Completing the Installation Checklist
Installing Accessories and Parallel System Control Wiring
Initial Startup
Installation Checklist
Parallel System Installation Checklist
Installing the UPS System
This page intentionally left blank
Batteries
Important Safety Instructions
Recycling the Used Battery or UPS
Installing Batteries
Repo Switch
Installing a Remote Emergency Power-off Switch
Repo Wire Terminations
Installing a Remote Emergency Power-off Switch
This page intentionally left blank
Installing a Powerware Hot Sync can Bridge Card
Installing Options and Accessories
Installing Parallel System Control Wiring
Installing a Remote Monitor Panel
Installing a Relay Interface Module
J1 through J4 Interface Connectors
Installing a Supervisory Contact Module
Supervisory Contact Module II TB2
This page intentionally left blank
Operation
This page intentionally left blank
Looking Inside the UPS System
Understanding UPS Operation
Single Module RT Modes
Single Module Reverse Transfer RT
Understanding UPS Operation
Path of Current Through the UPS in Normal Mode RT
Normal Mode RT
Understanding UPS Operation
Path of Current Through the UPS in Bypass Mode RT
Bypass Mode RT
Understanding UPS Operation
Path of Current Through the UPS in Battery Mode RT
Battery Mode RT
Multiple Module Parallel System
Multiple Module Parallel System Modes
Path of Current through the UPMs in Normal Mode Parallel
Normal Mode Parallel
Path of Current through the UPMs in Bypass Mode Parallel
Bypass Mode Parallel
Understanding UPS Operation
Path of Current through the UPMs in Battery Mode Parallel
Battery Mode Parallel
Inverter
Battery Charger and Advanced Battery Management
Functional Description
Input Rectifier
Batteries
Bypass
UPS Standard Features
Features, Options, and Accessories
Options and Accessories
Optional X-Slot Cards
Integrated Accessory Cabinet IAC-B, IAC-T, and IAC-D
Powerware Hot Sync Parallel System
Sync Control
Supervisory Contact Module
Symbols, Controls, and Indicators
Remote Monitor Panel
Relay Interface Module
UPS Control Panel
Using the Control Panel
Events Meters Controls Setup Load OFF D
Using the LCD and Pushbuttons
Time 11 35
Using the Main Menu
Events Meters Controls Setup Load OFF
Mimic Screen
History
Event Screens
Events
02 / 26
Unit Meter Screens
Unit
System Unit
Input
125% L1 L2L3 100% 75% 50%
Unit Battery Meter Screen
Battery Discharge Log
07/28/2005
LOG
Summary
Date 07/28/2005 Time 15 26
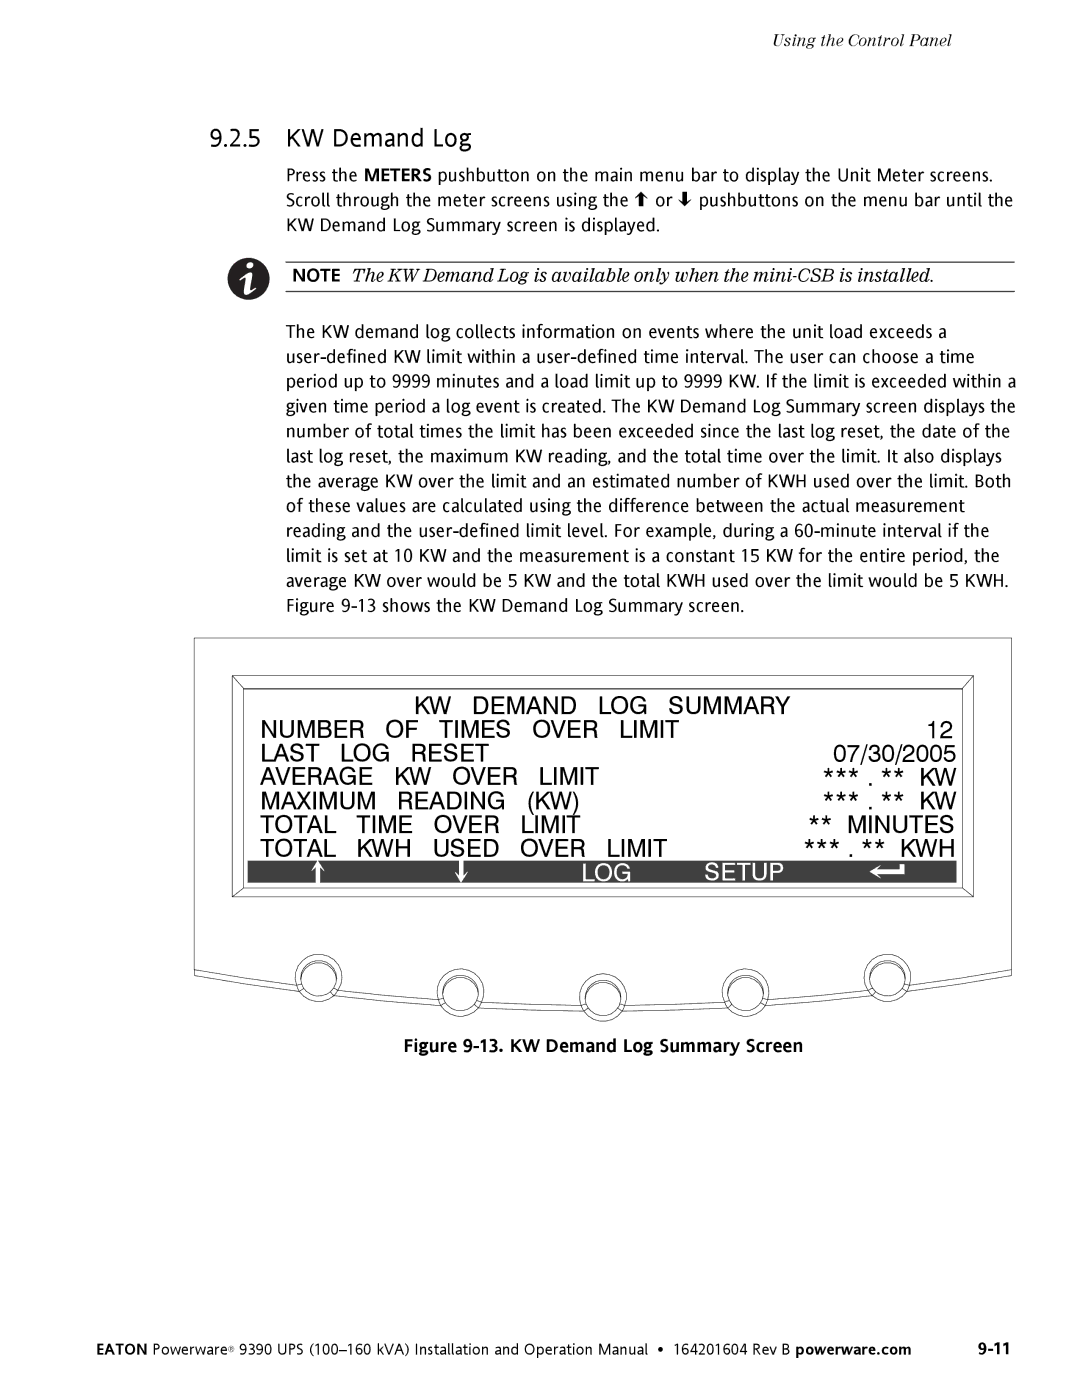
KW Demand Log
07/30/2005
KWH
14. KW Demand Log Screen
Summary Reset
Change
15. Current KW Demand Log Setup Screen
Select
Time Interval Monitored
Done
0000
Save Retry Abort
18. Time Interval Monitored Setup Save Screen
Maximum Level KW Setup
20. Maximum Level KW Setup Save Screen
08/04/2005
Maximum Current Log
Maximum Maximum Current
Maximum Current LOG
Maximum Current LOG Setup
26. Time Interval Monitored Setup Screen
27. Time Interval Monitored Setup Save Screen
000
28. Maximum % of Full Load Setup Screen
29. Maximum % of Full Load Setup Save Screen
30. Calculation Method Setup Screen
Level Based on 3 Phase Average
Total System
System Meters Screens
Output Total System KVA Freq
Output Unit KVA Freq
Input Unit KVA Freq
Battery Unit
Enter Password
System Setup Level 0 Screens
Save
70%
CTO Serial
57.00
42. Enter Password Screen
System Setup Level 1 Screens
LOG OUT
43. System Setup Level 1 Screen
Change Password OLD L1 NEW L1
45. Change Password Save Screen
Time Format Setup MM/DD/YYYY DD/MM/YYYY
2004
SET Date and Time MM/DD/YYYY Month
SET Date and Time DD/MM/YYYY Month Year Hour M Inute
COM
49. COM Port Setup Screen
Abort
50. COM Setup Screen
Load OFF Normal Bypass
System Controls Screen
52. System Controls Screen
Load OFF Chgr on PM OFF
Load Off Screen
Cancel Load OFF
Battery
Reading the Status Indicators
Starting the UPS in Normal Mode
UPS Operating Instructions
Single Module Operation
DC Starting Inverter Starting Inverter Syncing Ready Online
Starting the UPS in Bypass Mode
Transfer from Normal to Bypass Mode
Starting the Power Module
Transfer from Normal to Bypass Mode and Shut Down UPS
Transfer from Bypass to Normal Mode
Charger Control
UPS and Critical Load Shutdown
Using the UPS Load OFF Pushbutton
Using the Remote Emergency Power-off Switch
Multiple Module Parallel Operation
Starting the Parallel System in Normal Mode
Starting the Parallel System in Bypass Mode
Transfer Parallel System from Bypass to Normal Mode
Transfer Parallel System from Normal to Bypass Mode
Restarting a Single UPM
Single UPM Shutdown
Repeat Steps 2, 4, and 5 for each UPM, except the last UPM
Parallel System and Critical Load Shutdown
10-13
Using the Parallel System Remote Emergency Power-off Switch
Using Features and Options
Building Alarm Monitoring
General Purpose Relay Contact
Remote Monitor Panel
Optional Remote Monitor Panel
RMP II Status Indicators
Relay Interface Module
Customer Interface Connectors
Supervisory Contact Module
SCM II Status Indicators and Connections
This page intentionally left blank
System Event Horns
System Event Indicators
Responding to System Events
General
Alarms
Message Horn
Alarms
12-5
Message Horn
12-7
Status
Command
This page intentionally left blank
Slot Cards
Communication
Remote Notification
LanSafe Power Management Software
Display UPS Control Panel
Terminal Mode
Kywd Message
Event History Log
Sample Event History Log
This page intentionally left blank
Maintaining the UPS System
Daily Maintenance
Performing Preventive Maintenance
Battery Maintenance
Maintenance Training
Monthly Maintenance
Annual Maintenance
This page intentionally left blank
UPS System Input
Product Specifications
Single Module Specifications
Model Numbers
Environmental
UPS System Output
Multiple Module Parallel Specifications
This page intentionally left blank
Appendix a
Installation Information
Battery Cabinet UPS Cabinet
Description Physical Features and Requirements
Ambient Temperature Range
UPS System Oneline Configurations
UPS System SINGLE-FEED or DUAL-FEED
160/160 208/220V Input and Output
Typical Maintenance Bypass Panel Power Flow
+1 and 2+0 Configurations Critical Load
+1 and 3+0 Configurations Critical Load
+1 and 4+0 Configurations Critical Load
Power Wiring Installation Notes
Power Wiring Installation Notes
6, 4 of 6, 5 of 6, and 6
Terminal Function
Drawing no
Description Power Wiring Installation Notes
Table J. Power Cable Conduit Requirements Cont’d
Table L. Maximum Bypass and Output Circuit Breaker Ratings
Table M. Maximum DC Input Circuit Breaker Ratings
164201604---5 Sheet 10
MOB MIS MBP
Configuration Units Rating 50/60 Hz
All
Number See Note Each
Drawing no Sheet 15
Bottom View
Left Side View Right Side View
Models 120/100 and 120/120 480V Input and 480V Output
Terminal Detail
Used only on 160/100, 160/120, and 160/160 208V/220V Ratings
Phase a E9 AC Output to Phase B E10 Critical Load
Description Interface Wiring Installation
Interface Terminal Locations
Interface Terminals
MINI-CSB Interface Terminals
Table S. Battery Disconnect Interface
Table U. Remote EPO
AUX Contact Rating
K3 AUX Contact Rating
Powerware HOT Sync can Bridge Card
Parallel System can and Backup Control Pull Chain
Control Pull Chain Wiring
Supervisory Contact Module Terminal Locations
RMP, RIM, or SCM Wiring Terminations
Front View Right Side View
TOP View
Bottom View with Optional Floor Mounting Brackets
Sheet
Feet Maximum wire size #14 AWG. Minimum wire size #22 AWG
Description Optional Remote Monitor Panel
Description Optional Relay Interface Module
PIN D-SUB Connectors
Description Optional Supervisory Contact
Limited Factory Warranty for THREE-PHASE Powerware Products
Warranty
Warranty
Page
164201604B