Sometimes it is easier to see certain topographical features if they are exaggerated. Adjusting the exaggeration has the effect of vertically stretching objects on the chart, making it easier to see their shape and position. This could be particularly helpful if you are fishing, for example.
Adjusting the 3D chart exaggeration
In the 3D chart application:
1.Press the PRESENTATION softkey.
2.Press the 3D VIEW OPTIONS softkey.
3.Press the ADJUST EXAGGERATION softkey.
4.Using the trackpad, select the required amount of exaggeration.
5.Press the OK button.
3D chart decluttering
You can declutter the 3D chart to reduce the amount of objects and detail shown.
Navigating in an area that shows a lot of information on the chart, such as navigation marks, can be confusing. Depending on your chart view level it can make features or even your position difficult to see. Declutter helps you to reduce this confusion and make the chart clearer, by removing some objects from view.
Decluttering the 3D chart
In the 3D chart application:
1.Press the PRESENTATION softkey.
2.Press the DECLUTTER softkey until the ON or OFF option is selected, as appropriate.
3.Press the OK button.
Aerial photo overlay on 3D chart
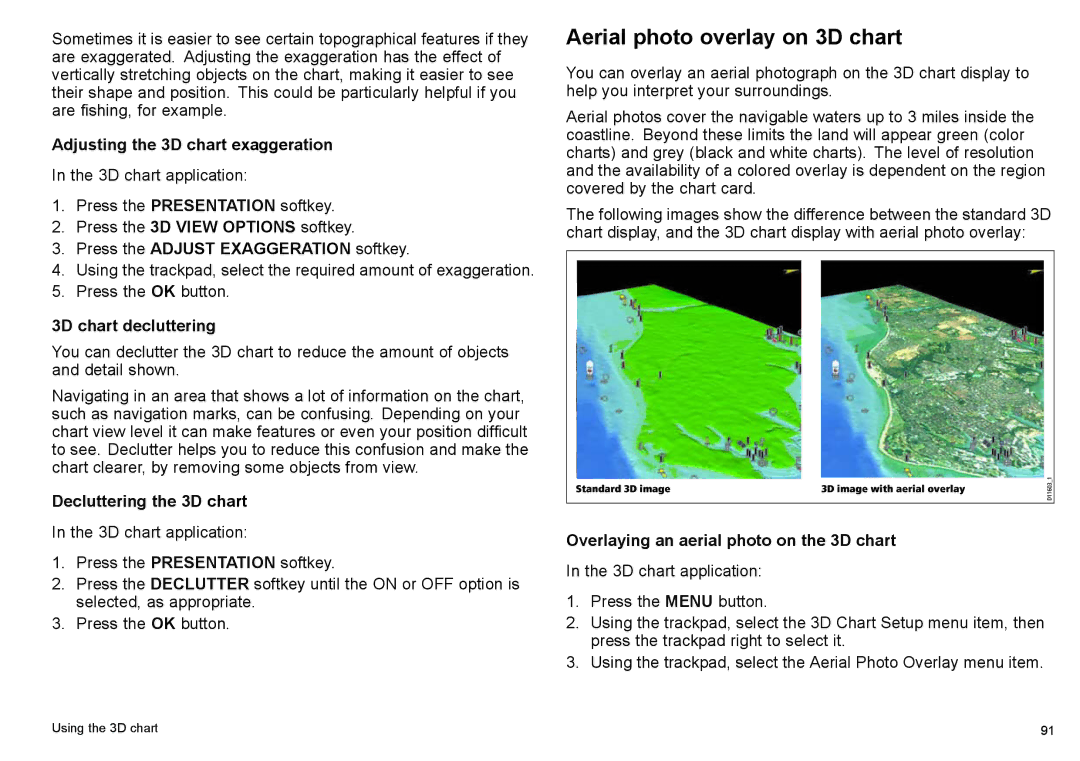
You can overlay an aerial photograph on the 3D chart display to help you interpret your surroundings.
Aerial photos cover the navigable waters up to 3 miles inside the coastline. Beyond these limits the land will appear green (color charts) and grey (black and white charts). The level of resolution and the availability of a colored overlay is dependent on the region covered by the chart card.
The following images show the difference between the standard 3D chart display, and the 3D chart display with aerial photo overlay:
Overlaying an aerial photo on the 3D chart
In the 3D chart application:
1.Press the MENU button.
2.Using the trackpad, select the 3D Chart Setup menu item, then press the trackpad right to select it.
3.Using the trackpad, select the Aerial Photo Overlay menu item.
Using the 3D chart | 91 |
