1 Displaying GSLB information
Displaying metric information
You can show the following information:
•The metrics that were used to select a given site as the best site.
•For each of the GSLB metrics that have been used to select the site, the number of times that metric was the deciding factor in selection of the site.
To view metric information, enter the following command.
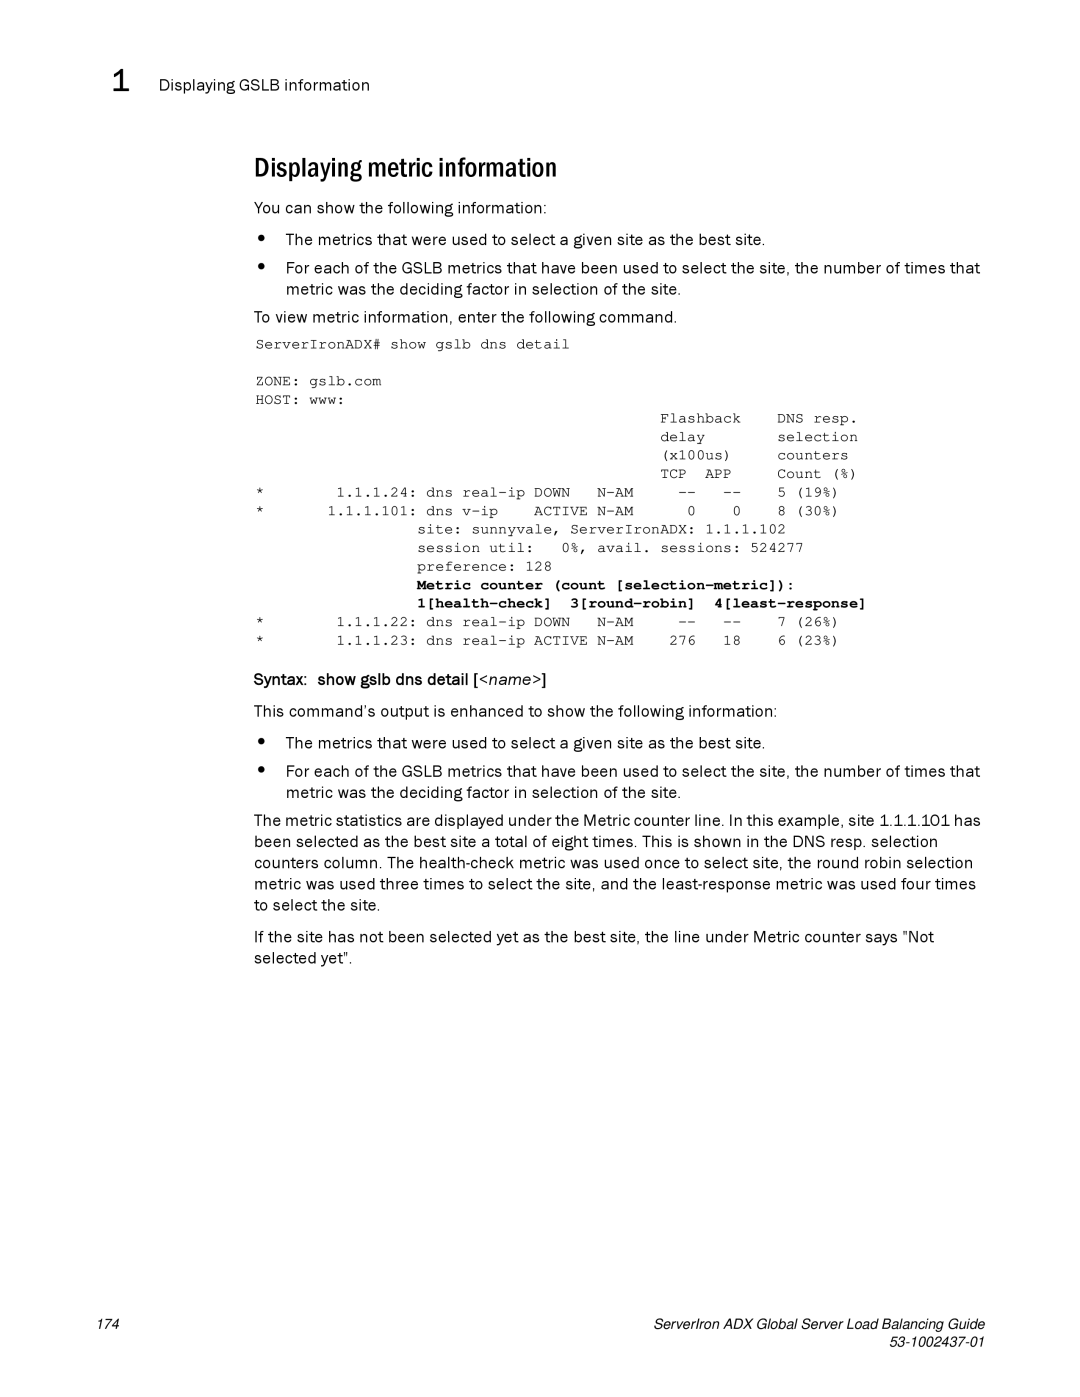
ServerIronADX# show gslb dns detail
ZONE: gslb.com |
|
|
|
|
|
| |
HOST: www: |
|
| Flashback | DNS resp. | |||
|
|
|
| ||||
|
|
|
| delay |
| selection | |
|
|
|
| (x100us) | counters | ||
* | 1.1.1.24: dns | TCP | APP | Count (%) | |||
5 | (19%) | ||||||
* | 1.1.1.101: dns | ACTIVE | 0 | 0 | 8 | (30%) | |
site: sunnyvale, ServerIronADX: 1.1.1.102
session util: 0%, avail. sessions: 524277
preference: 128
| Metric counter (count |
| ||||||
* | ||||||||
1.1.1.22: dns | DOWN | 7 | (26%) | |||||
* | 1.1.1.23: dns | ACTIVE | 276 | 18 | 6 | (23%) | ||
Syntax: show gslb dns detail [<name>]
This command’s output is enhanced to show the following information:
•The metrics that were used to select a given site as the best site.
•For each of the GSLB metrics that have been used to select the site, the number of times that metric was the deciding factor in selection of the site.
The metric statistics are displayed under the Metric counter line. In this example, site 1.1.1.101 has been selected as the best site a total of eight times. This is shown in the DNS resp. selection counters column. The
If the site has not been selected yet as the best site, the line under Metric counter says "Not selected yet".
174 | ServerIron ADX Global Server Load Balancing Guide |
|