Configuring GSLB protocol parameters | 1 |
Displaying results of traffic distribution for Weighted Sites
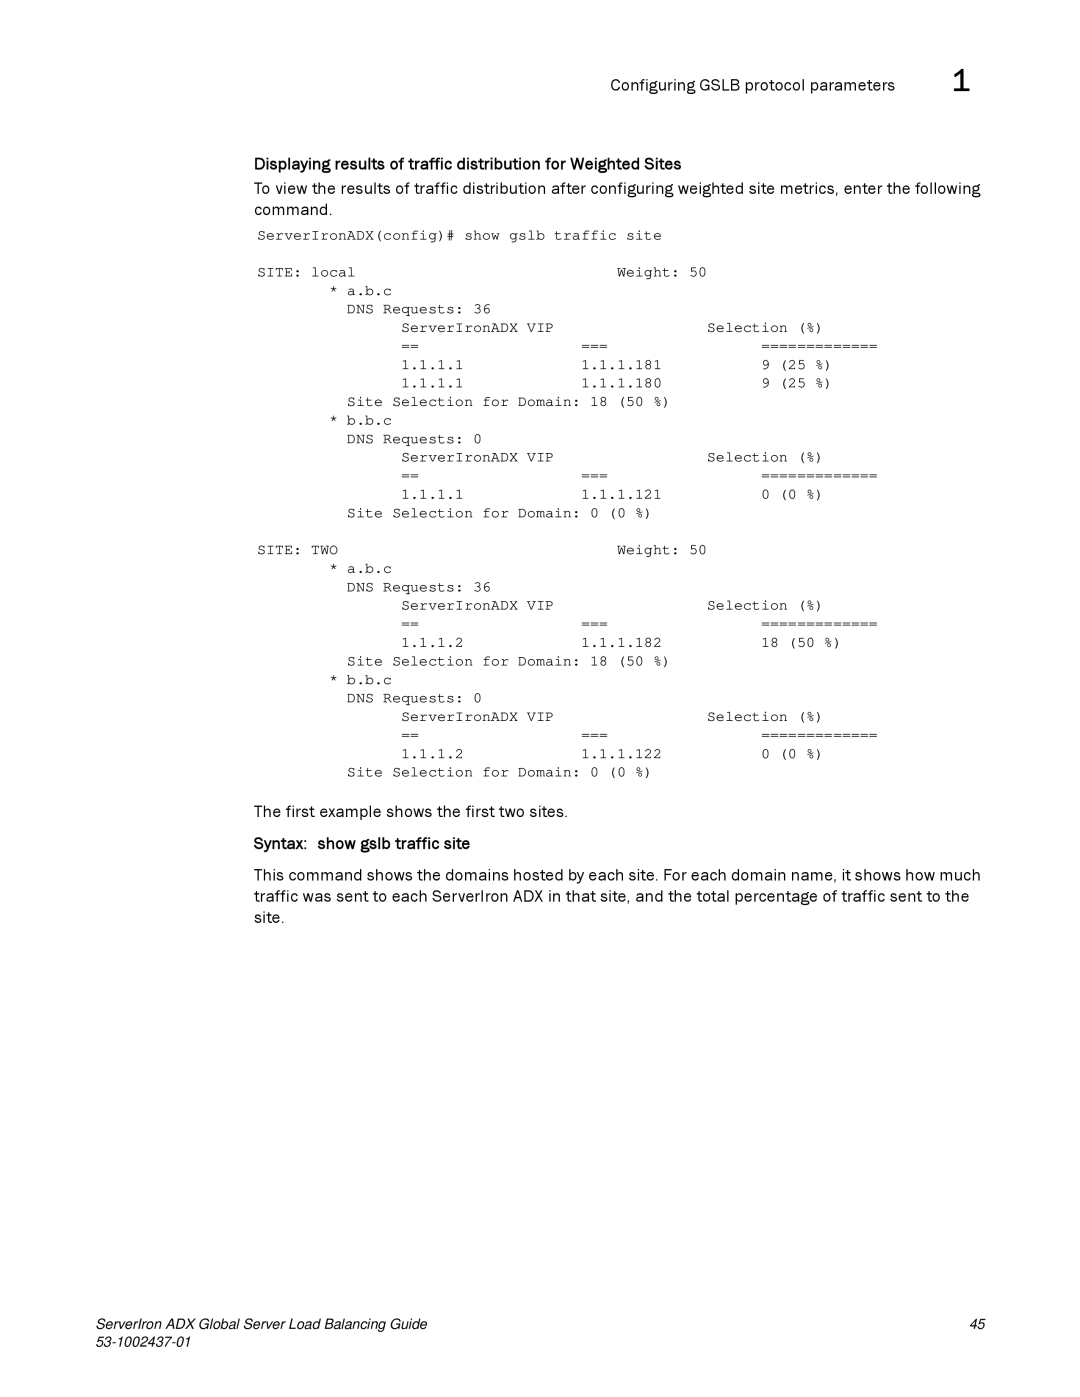
To view the results of traffic distribution after configuring weighted site metrics, enter the following command.
ServerIronADX(config)# show gslb traffic site
SITE: local | Weight: 50 |
|
|
|
* a.b.c |
|
|
|
|
DNS Requests: 36 |
| Selection (%) | ||
ServerIronADX VIP | === | |||
== | ============= | |||
1.1.1.1 | 1.1.1.181 | 9 | (25 | %) |
1.1.1.1 | 1.1.1.180 | 9 | (25 | %) |
Site Selection for Domain: 18 (50 %)
* b.b.c |
|
|
DNS Requests: 0 |
| Selection (%) |
ServerIronADX VIP | === | |
== | ============= | |
1.1.1.1 | 1.1.1.121 | 0 (0 %) |
Site Selection for Domain: 0 (0 %) |
| |
SITE: TWO | Weight: 50 |
|
* a.b.c |
|
|
DNS Requests: 36 |
| Selection (%) |
ServerIronADX VIP | === | |
== | ============= | |
1.1.1.2 | 1.1.1.182 | 18 (50 %) |
Site Selection for Domain: 18 (50 %) |
| |
* b.b.c |
|
|
DNS Requests: 0 |
| Selection (%) |
ServerIronADX VIP | === | |
== | ============= | |
1.1.1.2 | 1.1.1.122 | 0 (0 %) |
Site Selection for Domain: 0 (0 %)
The first example shows the first two sites.
Syntax: show gslb traffic site
This command shows the domains hosted by each site. For each domain name, it shows how much traffic was sent to each ServerIron ADX in that site, and the total percentage of traffic sent to the site.
ServerIron ADX Global Server Load Balancing Guide | 45 |
|
