Displaying GSLB for IPv6 configurations | 2 |
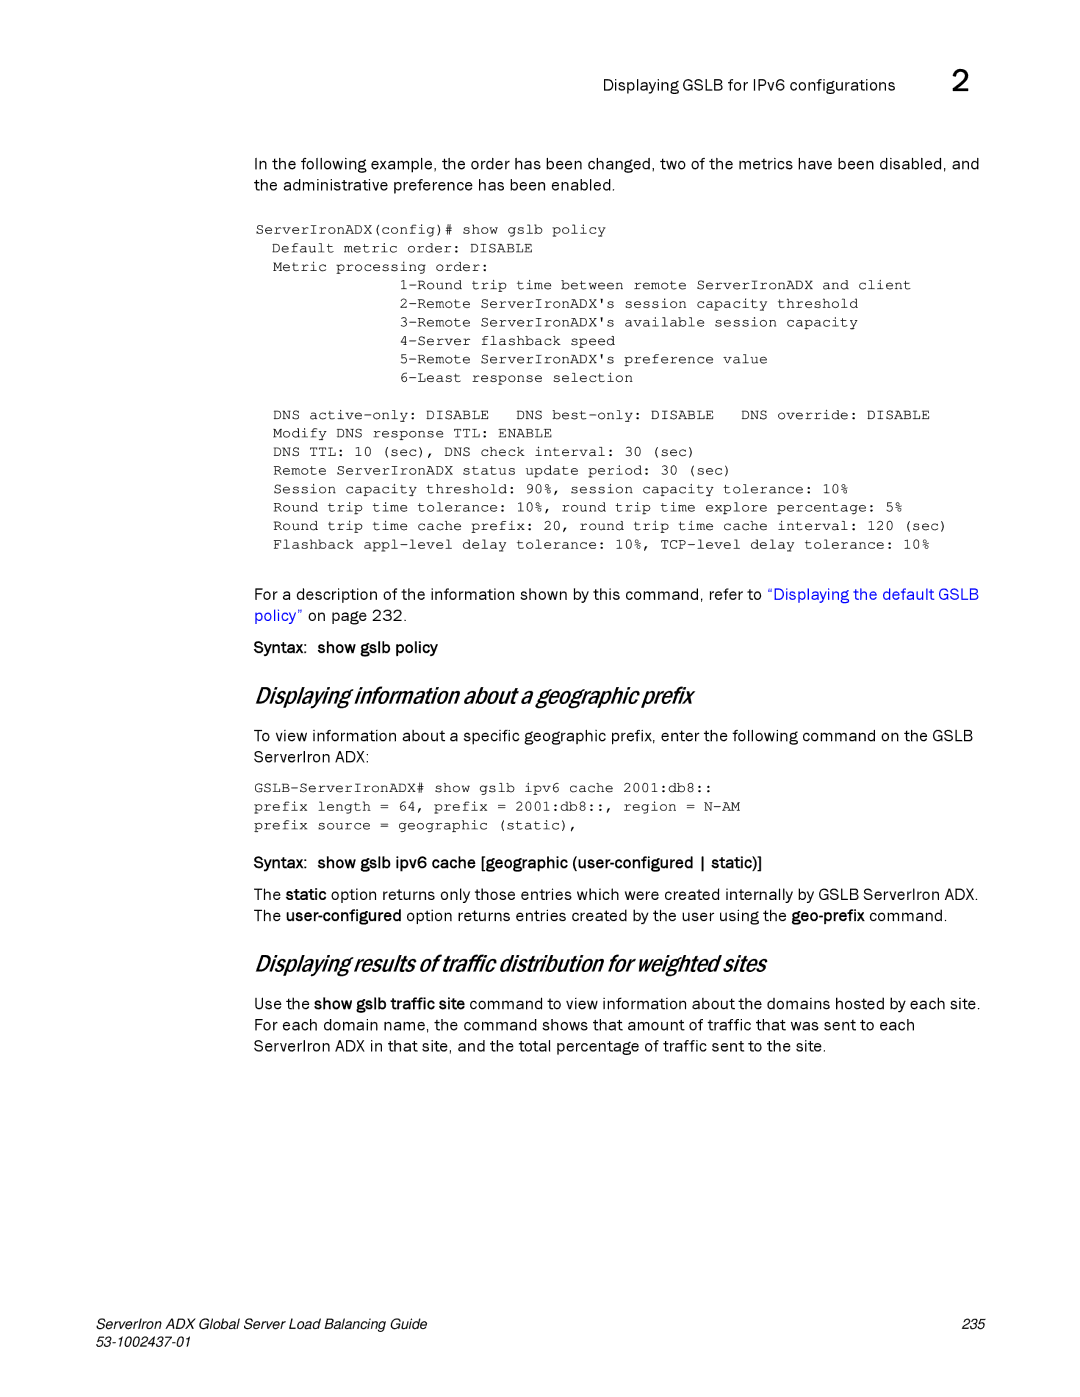
In the following example, the order has been changed, two of the metrics have been disabled, and the administrative preference has been enabled.
ServerIronADX(config)# show gslb policy Default metric order: DISABLE Metric processing order:
session capacity | threshold | ||
available session capacity | |||
flashback speed | preference value |
| |
ServerIronADX's |
| ||
|
| ||
DNS | DNS | DNS override: DISABLE | |
Modify DNS response TTL: ENABLE |
|
| |
DNS TTL: 10 (sec), DNS check interval: 30 (sec) |
|
| |
Remote ServerIronADX status update period: 30 (sec) |
|
| |
Session capacity threshold: 90%, session capacity tolerance: 10% |
| ||
Round trip time tolerance: 10%, round trip time explore percentage: 5% | (sec) | ||
Round trip time cache prefix: 20, round trip time cache interval: 120 | |||
Flashback | 10% | ||
For a description of the information shown by this command, refer to “Displaying the default GSLB policy” on page 232.
Syntax: show gslb policy
Displaying information about a geographic prefix
To view information about a specific geographic prefix, enter the following command on the GSLB ServerIron ADX:
Syntax: show gslb ipv6 cache [geographic
The static option returns only those entries which were created internally by GSLB ServerIron ADX. The
Displaying results of traffic distribution for weighted sites
Use the show gslb traffic site command to view information about the domains hosted by each site. For each domain name, the command shows that amount of traffic that was sent to each ServerIron ADX in that site, and the total percentage of traffic sent to the site.
ServerIron ADX Global Server Load Balancing Guide | 235 |
|