Enabling DNS request logging | 1 |
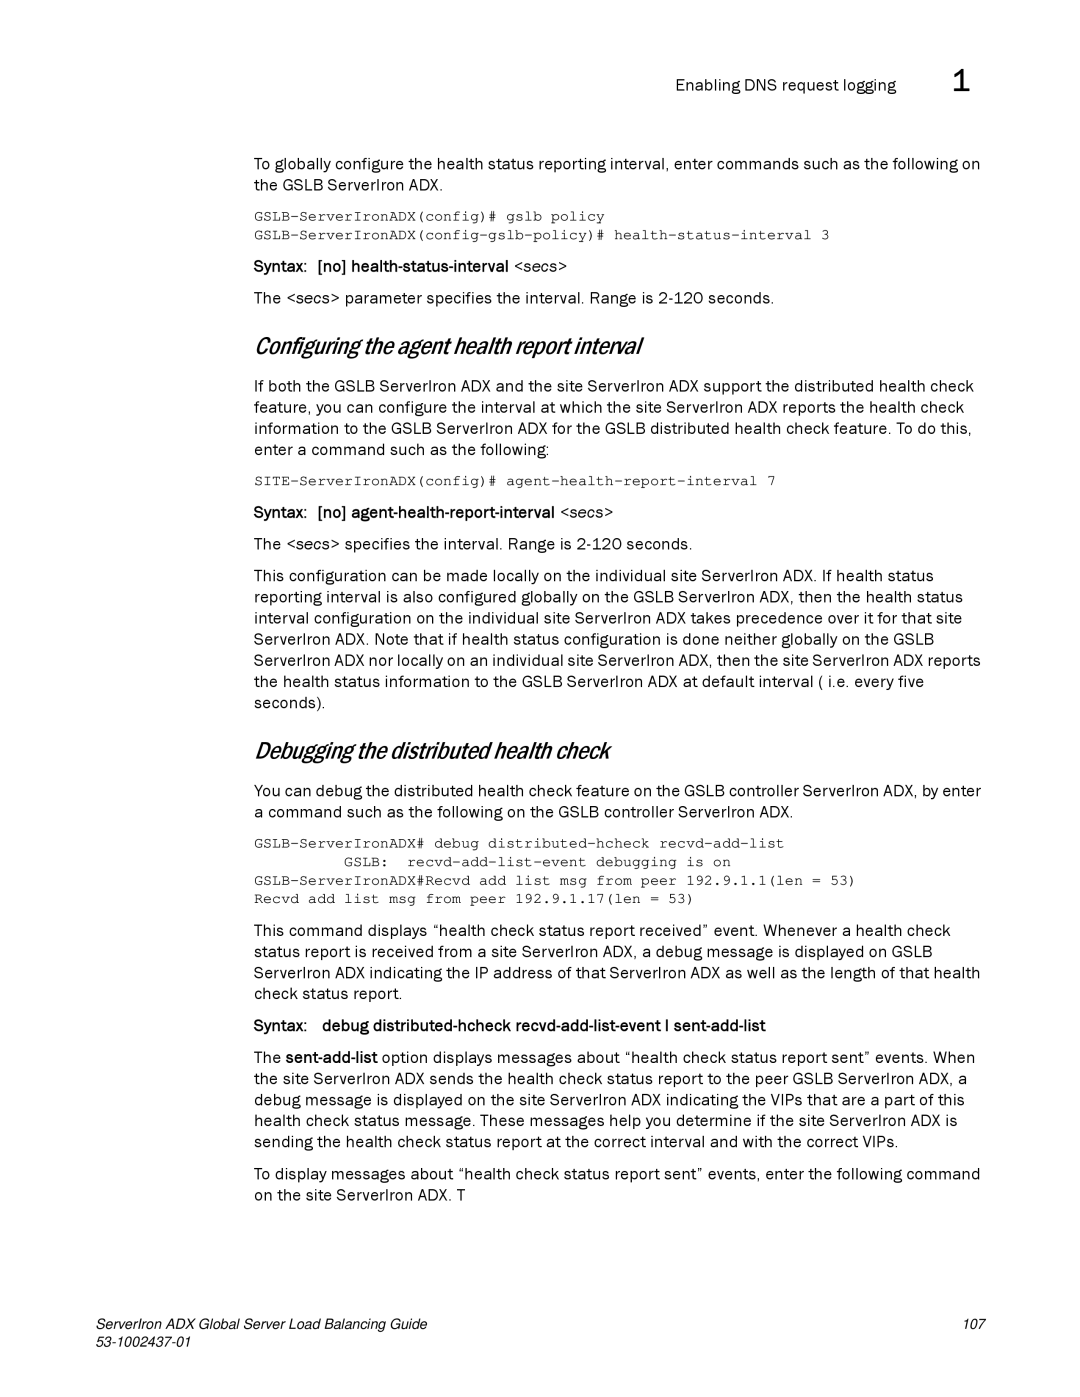
To globally configure the health status reporting interval, enter commands such as the following on the GSLB ServerIron ADX.
Syntax: [no] health-status-interval <secs>
The <secs> parameter specifies the interval. Range is
Configuring the agent health report interval
If both the GSLB ServerIron ADX and the site ServerIron ADX support the distributed health check feature, you can configure the interval at which the site ServerIron ADX reports the health check information to the GSLB ServerIron ADX for the GSLB distributed health check feature. To do this, enter a command such as the following:
Syntax: [no] agent-health-report-interval <secs>
The <secs> specifies the interval. Range is
This configuration can be made locally on the individual site ServerIron ADX. If health status reporting interval is also configured globally on the GSLB ServerIron ADX, then the health status interval configuration on the individual site ServerIron ADX takes precedence over it for that site ServerIron ADX. Note that if health status configuration is done neither globally on the GSLB ServerIron ADX nor locally on an individual site ServerIron ADX, then the site ServerIron ADX reports the health status information to the GSLB ServerIron ADX at default interval ( i.e. every five seconds).
Debugging the distributed health check
You can debug the distributed health check feature on the GSLB controller ServerIron ADX, by enter a command such as the following on the GSLB controller ServerIron ADX.
This command displays “health check status report received” event. Whenever a health check status report is received from a site ServerIron ADX, a debug message is displayed on GSLB ServerIron ADX indicating the IP address of that ServerIron ADX as well as the length of that health check status report.
Syntax: debug
The
To display messages about “health check status report sent” events, enter the following command on the site ServerIron ADX. T
ServerIron ADX Global Server Load Balancing Guide | 107 |
|
