The Device View
Rate
The count for the selected statistic during the last poll interval. The available parameters are the same as those provided for Raw Counts. Refer to the Raw Counts section, page
Viewing Interface Detail
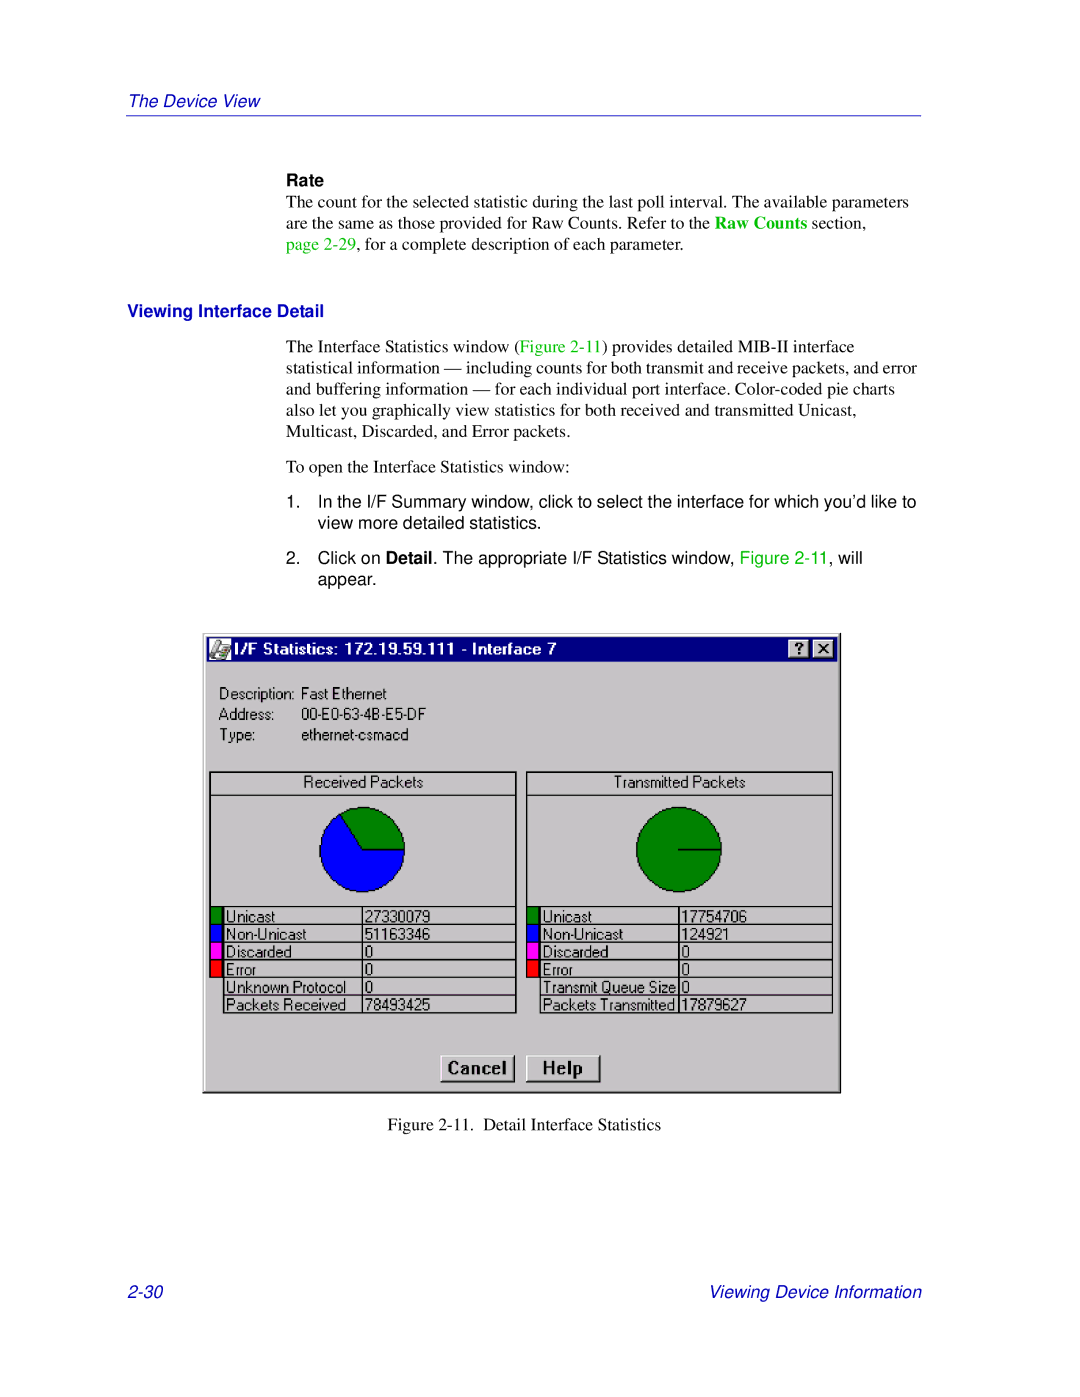
The Interface Statistics window (Figure
To open the Interface Statistics window:
1.In the I/F Summary window, click to select the interface for which you’d like to view more detailed statistics.
2.Click on Detail. The appropriate I/F Statistics window, Figure
Figure 2-11. Detail Interface Statistics
Viewing Device Information |