Managing Ethernet MicroLAN Modules
% Errors
The percentage of errors processed by the selected repeater, board, or port during the
Setting the Timer Statistics Interval
To set the Timer Statistics time interval:
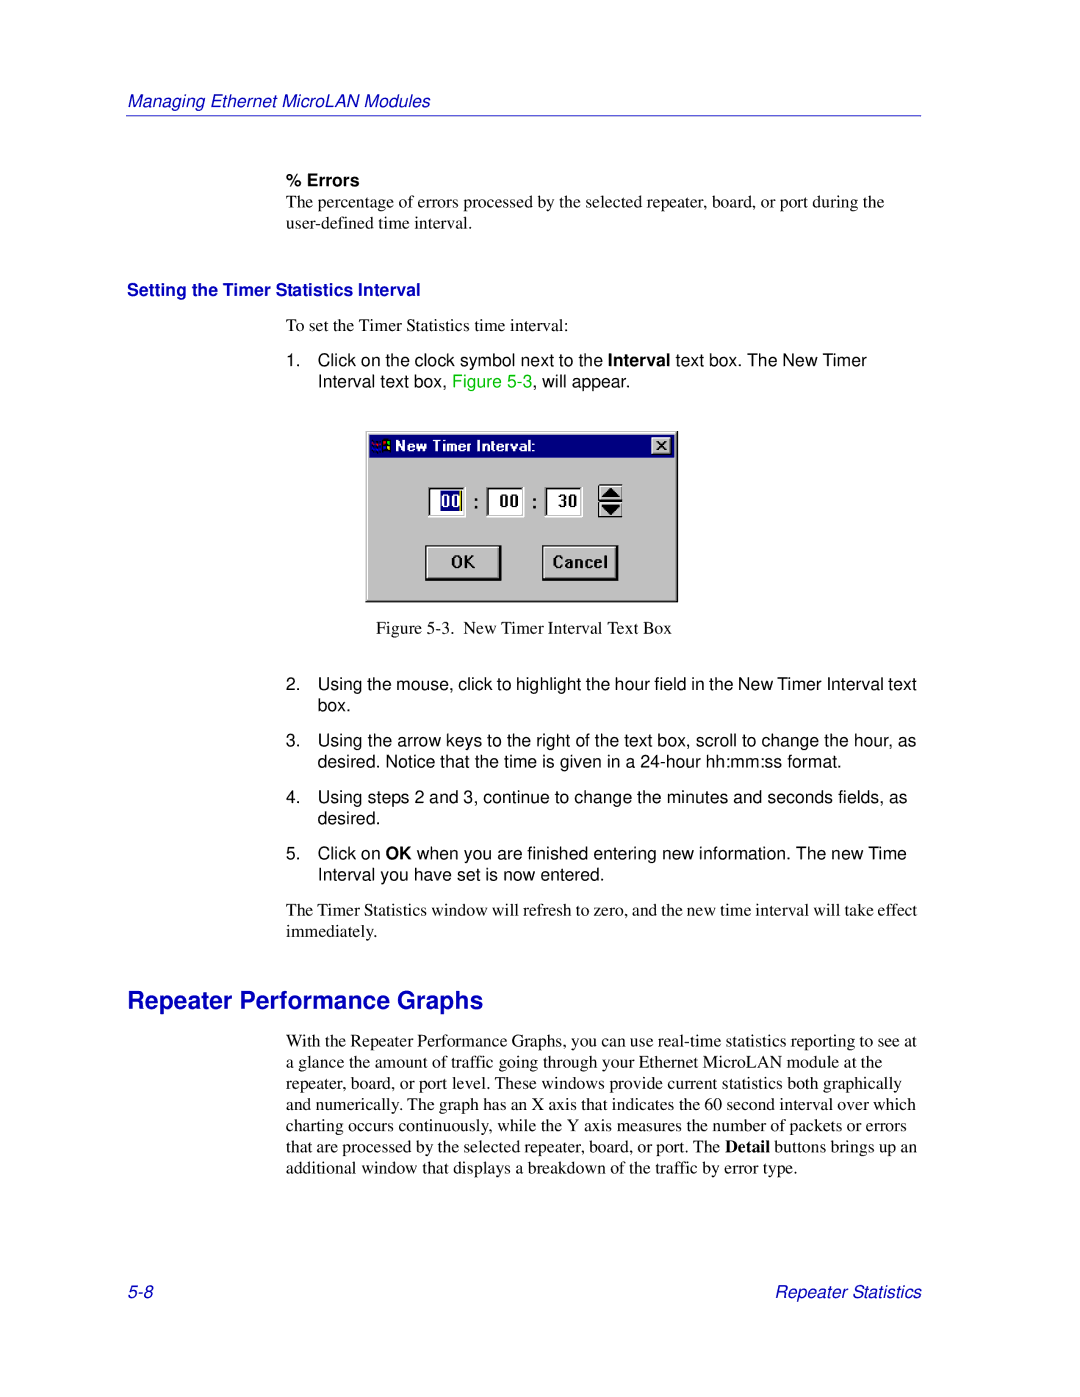
1.Click on the clock symbol next to the Interval text box. The New Timer Interval text box, Figure
Figure 5-3. New Timer Interval Text Box
2.Using the mouse, click to highlight the hour field in the New Timer Interval text box.
3.Using the arrow keys to the right of the text box, scroll to change the hour, as desired. Notice that the time is given in a
4.Using steps 2 and 3, continue to change the minutes and seconds fields, as desired.
5.Click on OK when you are finished entering new information. The new Time Interval you have set is now entered.
The Timer Statistics window will refresh to zero, and the new time interval will take effect immediately.
Repeater Performance Graphs
With the Repeater Performance Graphs, you can use
Repeater Statistics |