Statistics
3-2 RMON Statistics
RMON Statistics
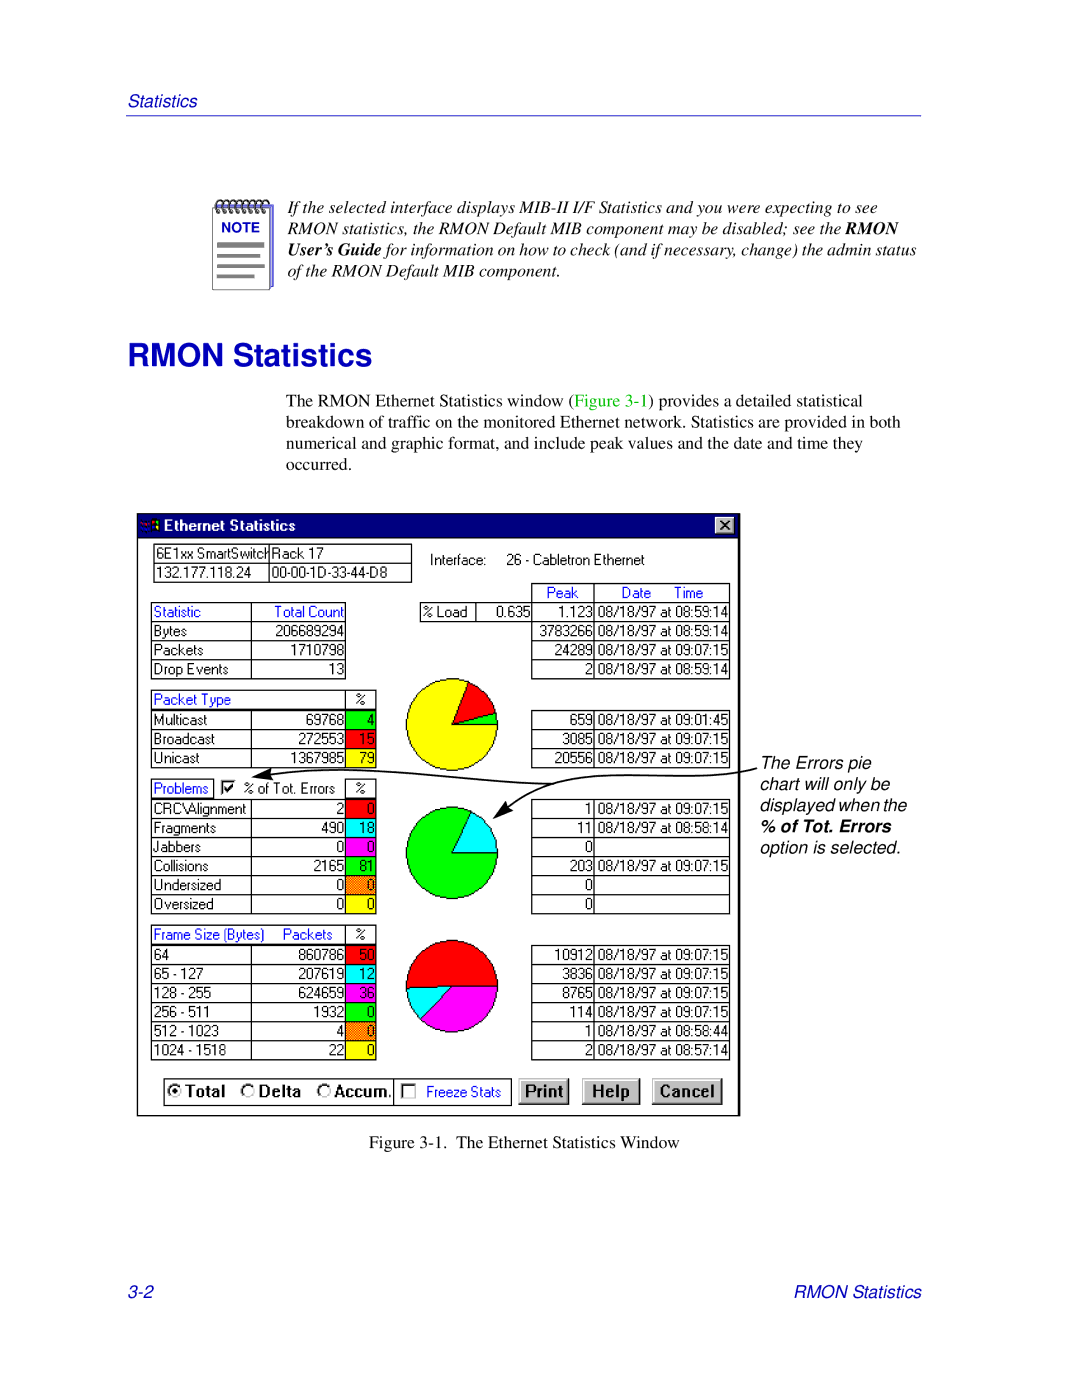
The RMON Ethernet Statistics window (Figure3-1) provides a detailed statistical
breakdown of traffic on the monitored Ethernet network. Statistics are provided in both
numerical and graphic format, and include peak values and the date and time they
occurred.
Figure3-1. The Ethernet Statistics Window
NOTE
If the selected interface displays MIB-II I/F Statistics and you were expecting to see
RMON statistics, the RMON Default MIB component may be disabled; see the RMON
User’s Guide for information on how to check (and if necessary, change) the admin status
of the RMON Default MIB component.
The Errors pie
chart will only be
displayed when the
% of Tot. Errors
option is selected.