FDDI Management
Performance
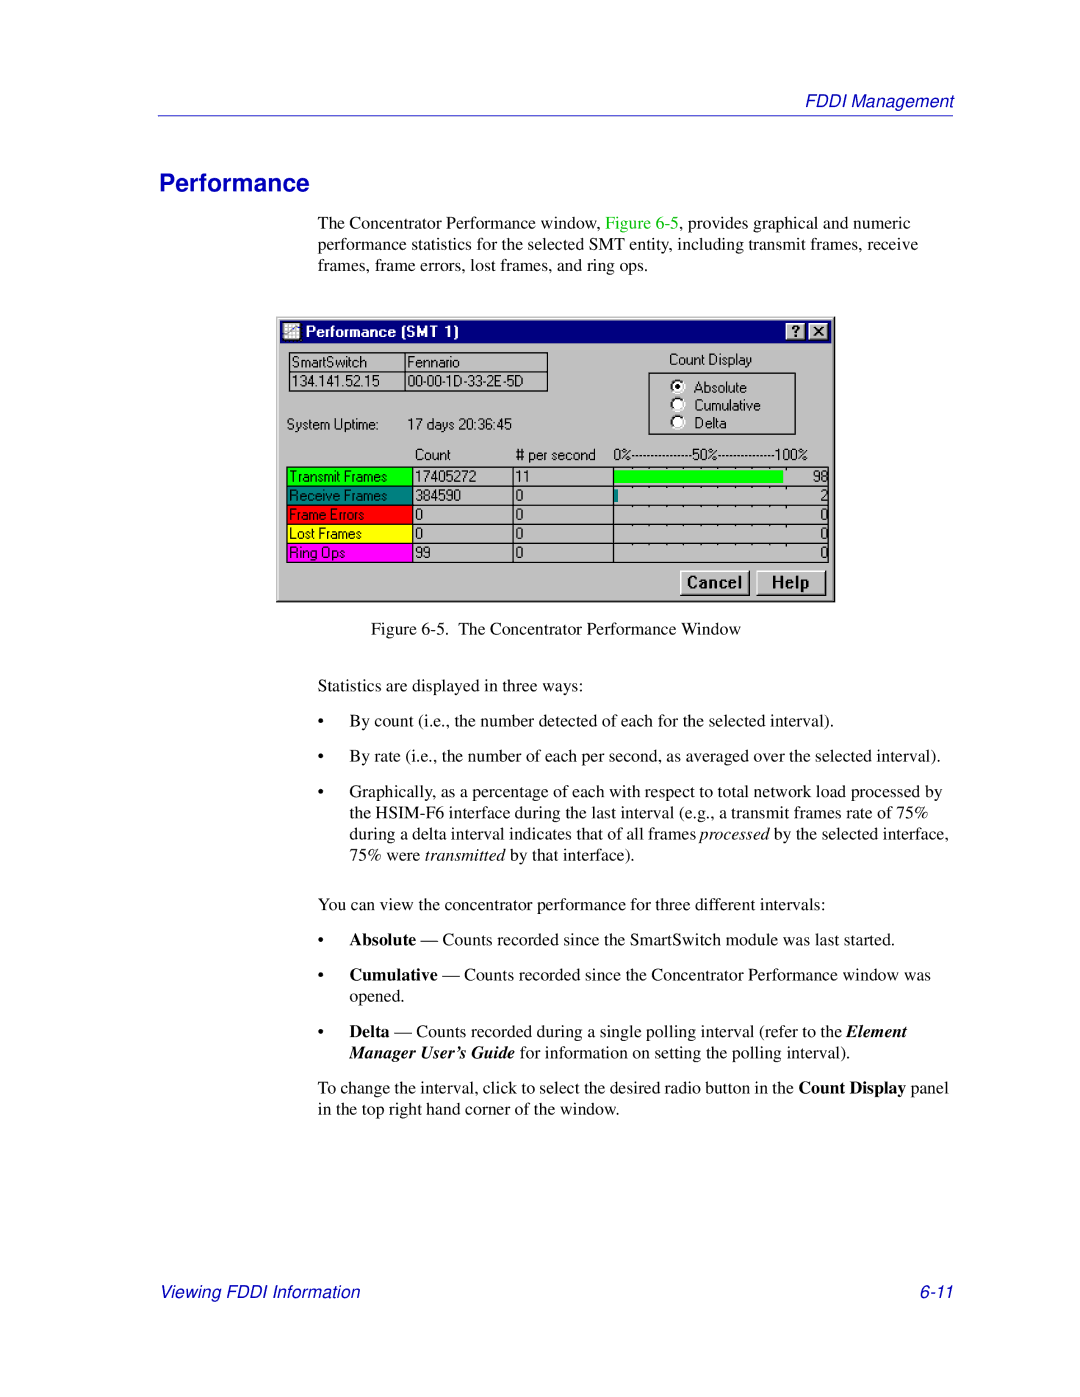
The Concentrator Performance window, Figure
Figure 6-5. The Concentrator Performance Window
Statistics are displayed in three ways:
•By count (i.e., the number detected of each for the selected interval).
•By rate (i.e., the number of each per second, as averaged over the selected interval).
•Graphically, as a percentage of each with respect to total network load processed by the HSIM-F6 interface during the last interval (e.g., a transmit frames rate of 75% during a delta interval indicates that of all frames processed by the selected interface, 75% were transmitted by that interface).
You can view the concentrator performance for three different intervals:
•Absolute — Counts recorded since the SmartSwitch module was last started.
•Cumulative — Counts recorded since the Concentrator Performance window was opened.
• | Delta — Counts recorded during a single polling interval (refer to the Element |
| Manager User’s Guide for information on setting the polling interval). |
To change the interval, click to select the desired radio button in the Count Display panel in the top right hand corner of the window.
Viewing FDDI Information |
