Managing Ethernet MicroLAN Modules
Configuring the Performance Graphs
To configure the Performance Graphs:
1.Click on the Percent Load button; select the desired Load mode from the menu.
2.Click on the Frames button; select the desired Frames mode from the menu.
3.Click on the Total Errors button; select the desired Errors mode from the menu.
Once you have selected a new mode, it will appear in its respective button, and the Performance Graph and statistics will refresh and begin to measure using the new mode. To stop monitoring and exit the window, click Cancel.
The Detail Button
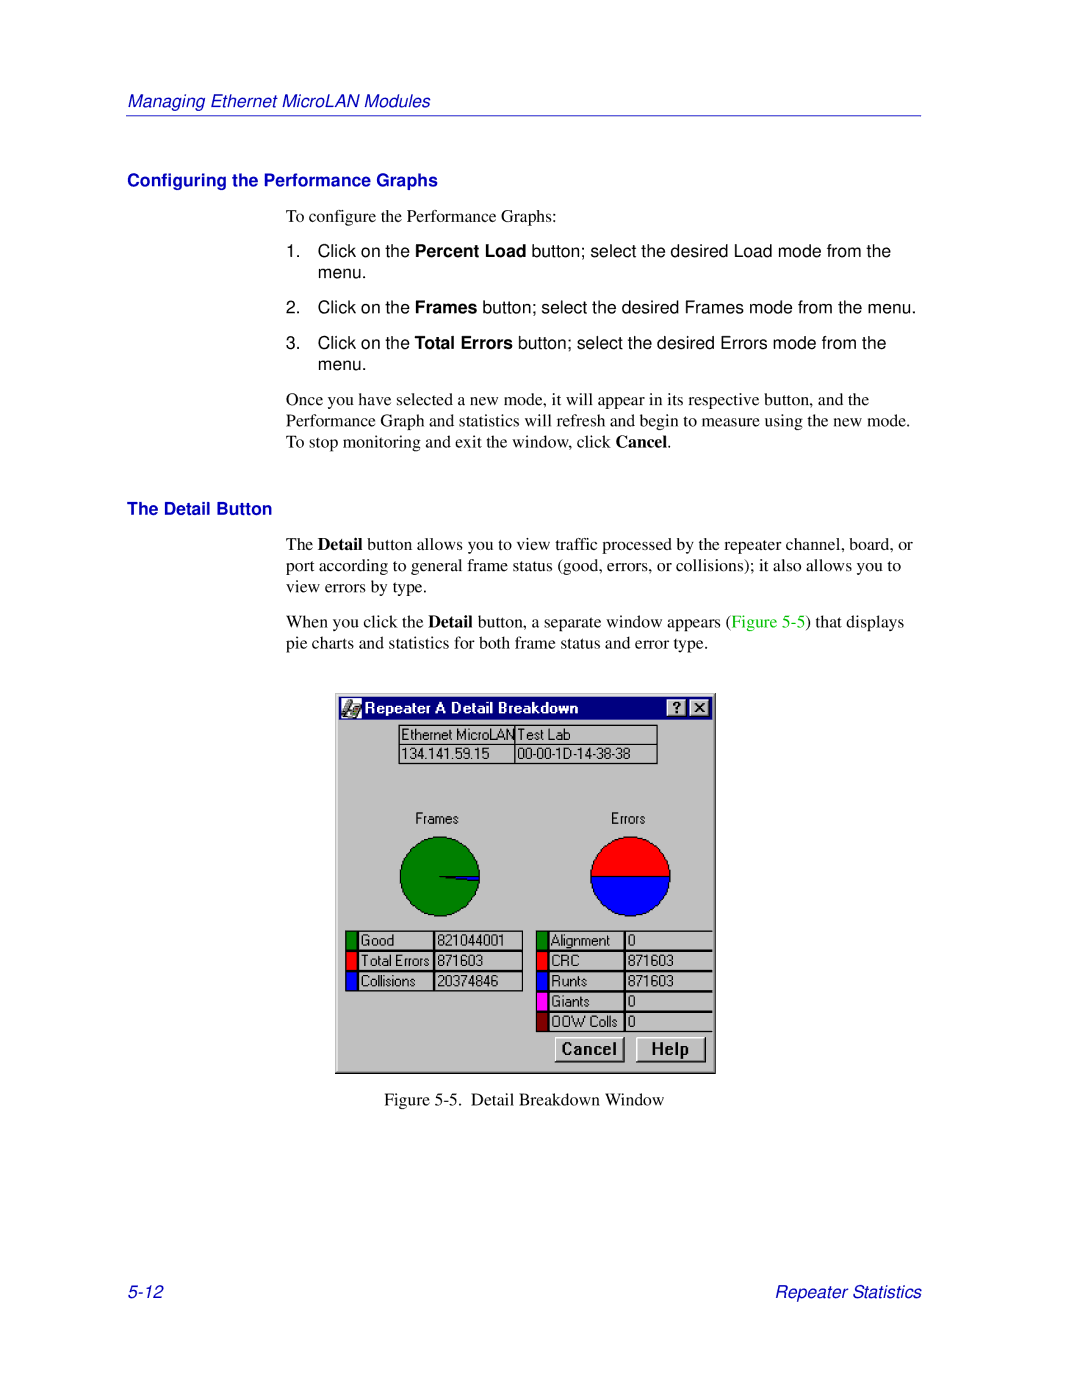
The Detail button allows you to view traffic processed by the repeater channel, board, or port according to general frame status (good, errors, or collisions); it also allows you to view errors by type.
When you click the Detail button, a separate window appears (Figure
Figure 5-5. Detail Breakdown Window
Repeater Statistics |