Chapter 6: Debugging with Visual Studio

149

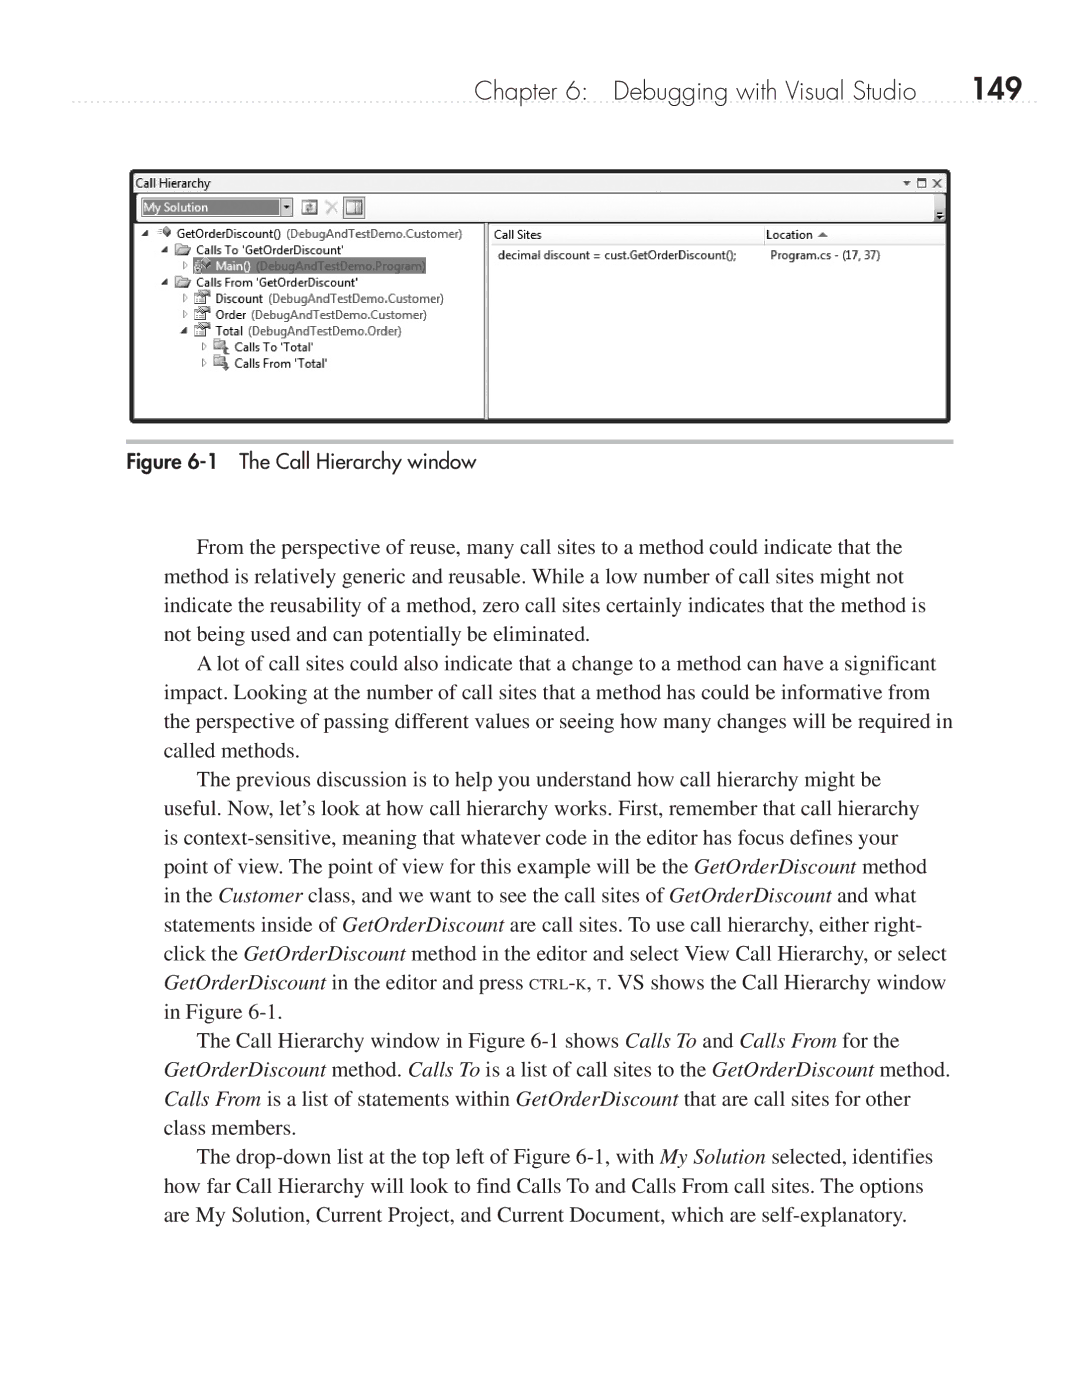
Figure 6-1 The Call Hierarchy window

From the perspective of reuse, many call sites to a method could indicate that the method is relatively generic and reusable. While a low number of call sites might not indicate the reusability of a method, zero call sites certainly indicates that the method is not being used and can potentially be eliminated.

A lot of call sites could also indicate that a change to a method can have a significant impact. Looking at the number of call sites that a method has could be informative from the perspective of passing different values or seeing how many changes will be required in called methods.

The previous discussion is to help you understand how call hierarchy might be useful. Now, let’s look at how call hierarchy works. First, remember that call hierarchy is context-sensitive, meaning that whatever code in the editor has focus defines your point of view. The point of view for this example will be the GetOrderDiscount method in the Customer class, and we want to see the call sites of GetOrderDiscount and what statements inside of GetOrderDiscount are call sites. To use call hierarchy, either right- click the GetOrderDiscount method in the editor and select View Call Hierarchy, or select GetOrderDiscount in the editor and press CTRL-K, T. VS shows the Call Hierarchy window in Figure 6-1.

The Call Hierarchy window in Figure 6-1 shows Calls To and Calls From for the GetOrderDiscount method. Calls To is a list of call sites to the GetOrderDiscount method. Calls From is a list of statements within GetOrderDiscount that are call sites for other class members.

The drop-down list at the top left of Figure 6-1, with My Solution selected, identifies how far Call Hierarchy will look to find Calls To and Calls From call sites. The options are My Solution, Current Project, and Current Document, which are self-explanatory.

Page 172
Image 172
Microsoft 9GD00001 manual 149, Call Hierarchy window