156Microsoft Visual Studio 2010: A Beginner’s Guide

Creating a Breakpoint

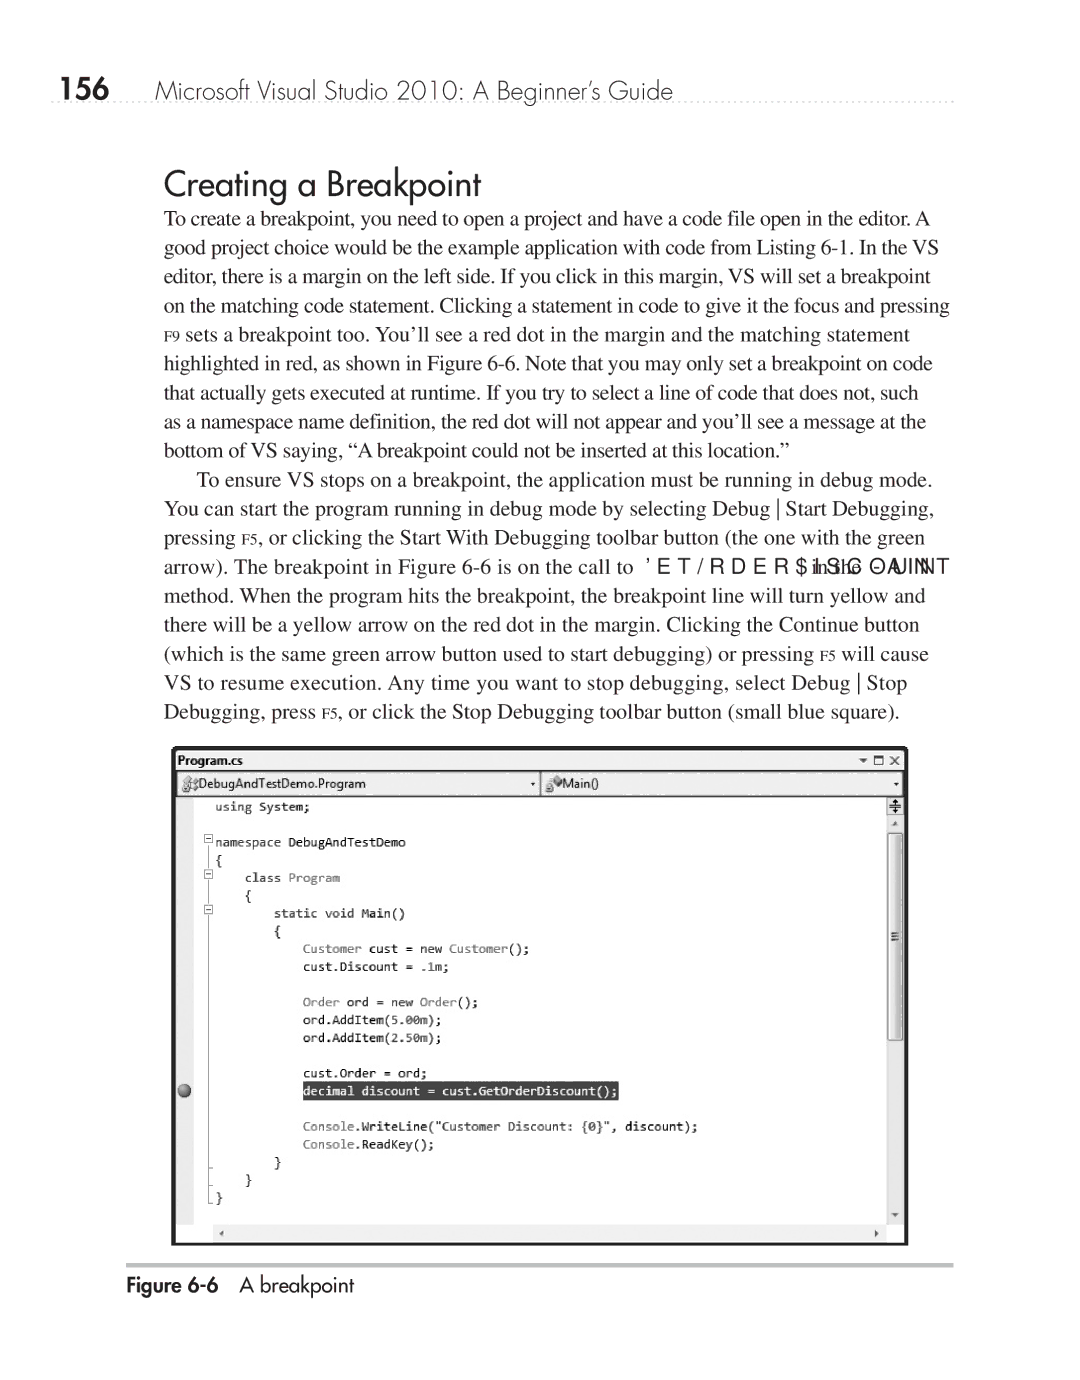
To create a breakpoint, you need to open a project and have a code file open in the editor. A good project choice would be the example application with code from Listing 6-1. In the VS editor, there is a margin on the left side. If you click in this margin, VS will set a breakpoint on the matching code statement. Clicking a statement in code to give it the focus and pressing F9 sets a breakpoint too. You’ll see a red dot in the margin and the matching statement highlighted in red, as shown in Figure 6-6. Note that you may only set a breakpoint on code that actually gets executed at runtime. If you try to select a line of code that does not, such as a namespace name definition, the red dot will not appear and you’ll see a message at the bottom of VS saying, “A breakpoint could not be inserted at this location.”

To ensure VS stops on a breakpoint, the application must be running in debug mode. You can start the program running in debug mode by selecting Debug Start Debugging, pressing F5, or clicking the Start With Debugging toolbar button (the one with the green arrow). The breakpoint in Figure 6-6 is on the call to GetOrderDiscount in the Main method. When the program hits the breakpoint, the breakpoint line will turn yellow and there will be a yellow arrow on the red dot in the margin. Clicking the Continue button (which is the same green arrow button used to start debugging) or pressing F5 will cause VS to resume execution. Any time you want to stop debugging, select Debug Stop Debugging, press F5, or click the Stop Debugging toolbar button (small blue square).

Figure 6-6 A breakpoint

Page 179
Image 179
Microsoft 9GD00001 manual Creating a Breakpoint, A breakpoint