Chapter 6: Debugging with Visual Studio | 157 |
TIP
If you write a program that is doing a lot of work, or very little work but is stuck in an endless loop that you inadvertently created, you can pause execution by selecting the blue pair of vertical bars button found to the left of the square blue stop button. When you do this, your program stops at whatever line of code it was executing at the moment you selected the pause button. You can then resume from that point. This button works much like the pause button on a remote control or a personal media player.
Customizing a Breakpoint
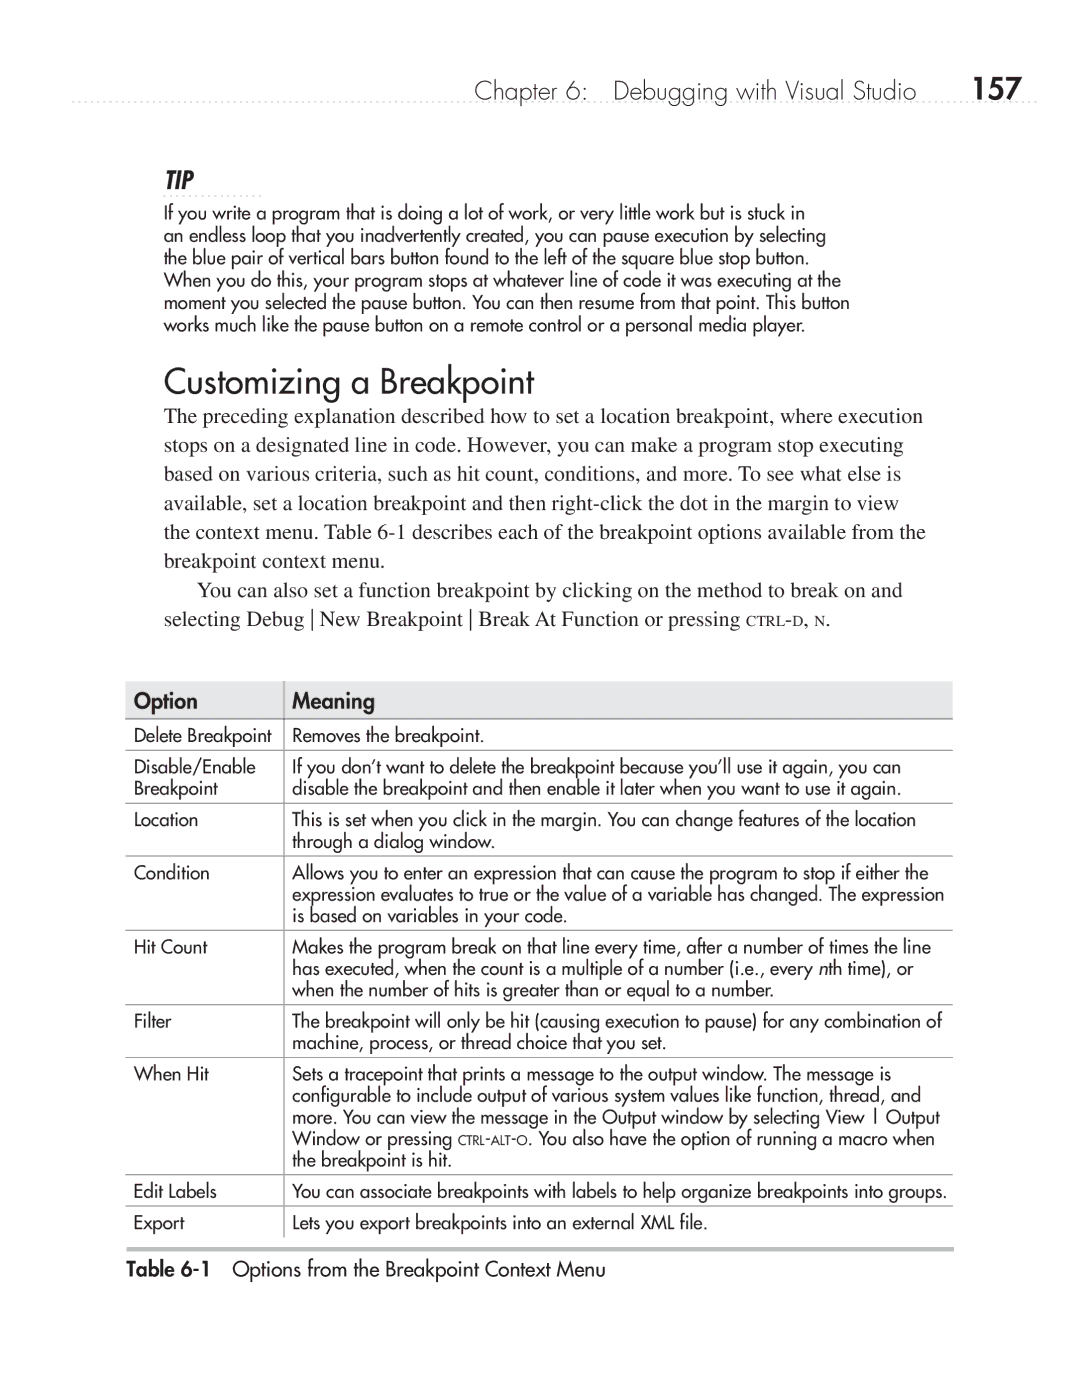
The preceding explanation described how to set a location breakpoint, where execution stops on a designated line in code. However, you can make a program stop executing based on various criteria, such as hit count, conditions, and more. To see what else is available, set a location breakpoint and then
You can also set a function breakpoint by clicking on the method to break on and selecting Debug New Breakpoint Break At Function or pressing
Option
Meaning
Delete Breakpoint | Removes the breakpoint. |
|
|
Disable/Enable | If you don’t want to delete the breakpoint because you’ll use it again, you can |
Breakpoint | disable the breakpoint and then enable it later when you want to use it again. |
Location | This is set when you click in the margin. You can change features of the location |
| through a dialog window. |
Condition | Allows you to enter an expression that can cause the program to stop if either the |
| expression evaluates to true or the value of a variable has changed. The expression |
| is based on variables in your code. |
Hit Count | Makes the program break on that line every time, after a number of times the line |
| has executed, when the count is a multiple of a number (i.e., every nth time), or |
| when the number of hits is greater than or equal to a number. |
Filter | The breakpoint will only be hit (causing execution to pause) for any combination of |
| machine, process, or thread choice that you set. |
When Hit | Sets a tracepoint that prints a message to the output window. The message is |
| configurable to include output of various system values like function, thread, and |
| more. You can view the message in the Output window by selecting View Output |
| Window or pressing |
| the breakpoint is hit. |
Edit Labels | You can associate breakpoints with labels to help organize breakpoints into groups. |
|
|
Export | Lets you export breakpoints into an external XML file. |
|
|
