166Microsoft Visual Studio 2010: A Beginner’s Guide
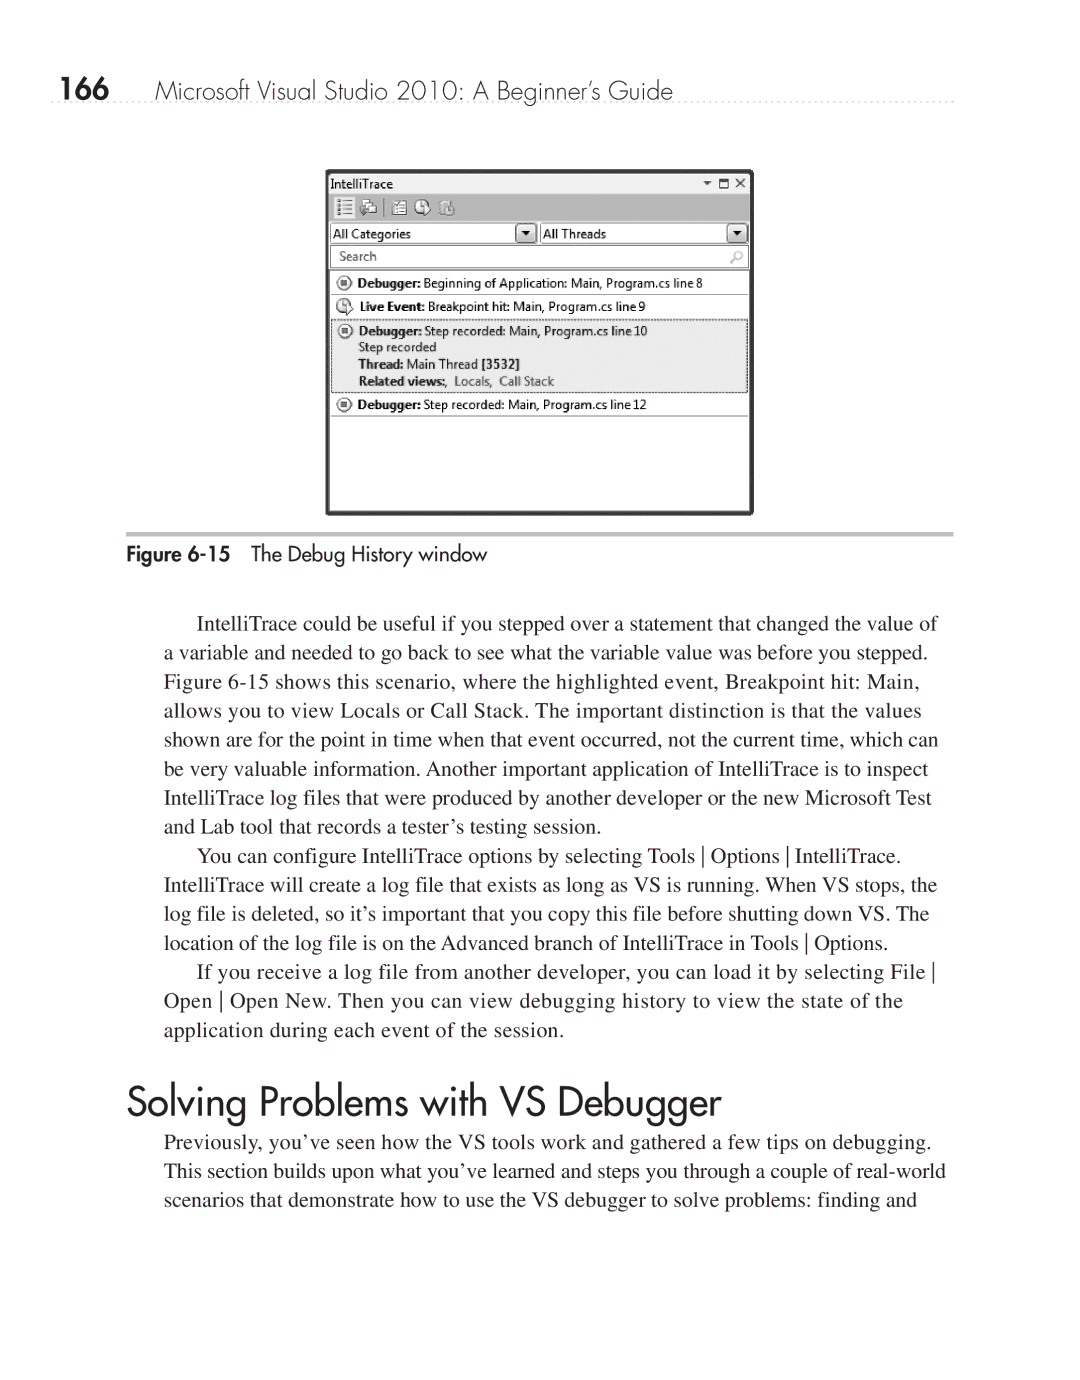
Figure 6-15 The Debug History window
IntelliTrace could be useful if you stepped over a statement that changed the value of a variable and needed to go back to see what the variable value was before you stepped. Figure
You can configure IntelliTrace options by selecting Tools Options IntelliTrace. IntelliTrace will create a log file that exists as long as VS is running. When VS stops, the log file is deleted, so it’s important that you copy this file before shutting down VS. The location of the log file is on the Advanced branch of IntelliTrace in Tools Options.
If you receive a log file from another developer, you can load it by selecting File Open Open New. Then you can view debugging history to view the state of the application during each event of the session.
Solving Problems with VS Debugger
Previously, you’ve seen how the VS tools work and gathered a few tips on debugging. This section builds upon what you’ve learned and steps you through a couple of