Q-Logic 5600 manual Fabric Status, Topology Display Switch and Status Icons

Models: 5600

1 336
Download 336 pages 25.61 Kb
Page 75
Image 75

A

3 – Managing Fabrics Displaying Fabric Information

3.5.1

Fabric Status

The fabric updates the topology and faceplate displays by forwarding changes in status to the management workstation as they occur. You can allow the fabric to update the display status, or you can refresh the display at any time. To refresh the topology display, do one of the following:

„Click the Refresh button.

„Open the View menu and select Refresh.

„Press the F5 key.

„Right-click anywhere in the background of the topology display and select Refresh Fabric from the popup menu.

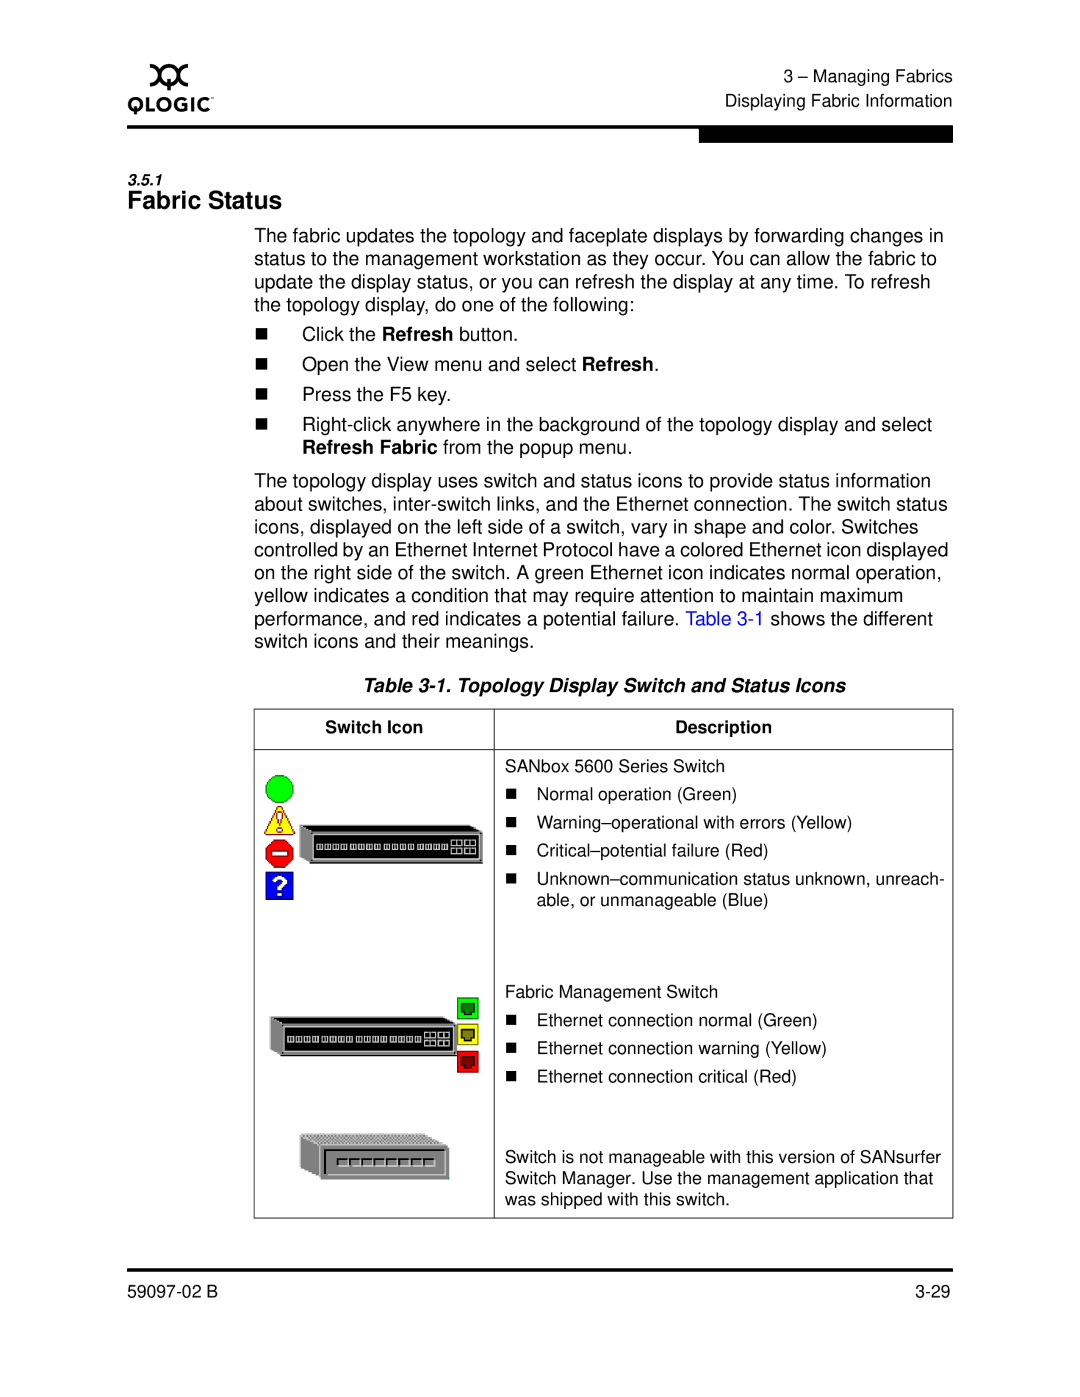
The topology display uses switch and status icons to provide status information about switches, inter-switch links, and the Ethernet connection. The switch status icons, displayed on the left side of a switch, vary in shape and color. Switches controlled by an Ethernet Internet Protocol have a colored Ethernet icon displayed on the right side of the switch. A green Ethernet icon indicates normal operation, yellow indicates a condition that may require attention to maintain maximum performance, and red indicates a potential failure. Table 3-1shows the different switch icons and their meanings.

Table 3-1. Topology Display Switch and Status Icons

Switch Icon

Description

SANbox 5600 Series Switch

„Normal operation (Green)

„Warning–operational with errors (Yellow)

„Critical–potential failure (Red)

„Unknown–communication status unknown, unreach- able, or unmanageable (Blue)

Fabric Management Switch

„Ethernet connection normal (Green)

„Ethernet connection warning (Yellow)

„Ethernet connection critical (Red)

Switch is not manageable with this version of SANsurfer Switch Manager. Use the management application that was shipped with this switch.

59097-02 B

3-29

Page 75
Image 75
Q-Logic 5600 manual Fabric Status, Topology Display Switch and Status Icons