Q-Logic 5600 manual Displaying the Event Browser, Events Browser

Models: 5600

1 336
Download 336 pages 25.61 Kb
Page 76
Image 76

3 – Managing Fabrics Displaying Fabric Information

S

3.5.2

Displaying the Event Browser

The Event Browser displays a list of events generated by the switches in the fabric and the SANsurfer Switch Manager application. Events that are generated by the SANsurfer Switch Manager application are not saved on the switch, but can be saved to a file during the SANsurfer Switch Manager session.

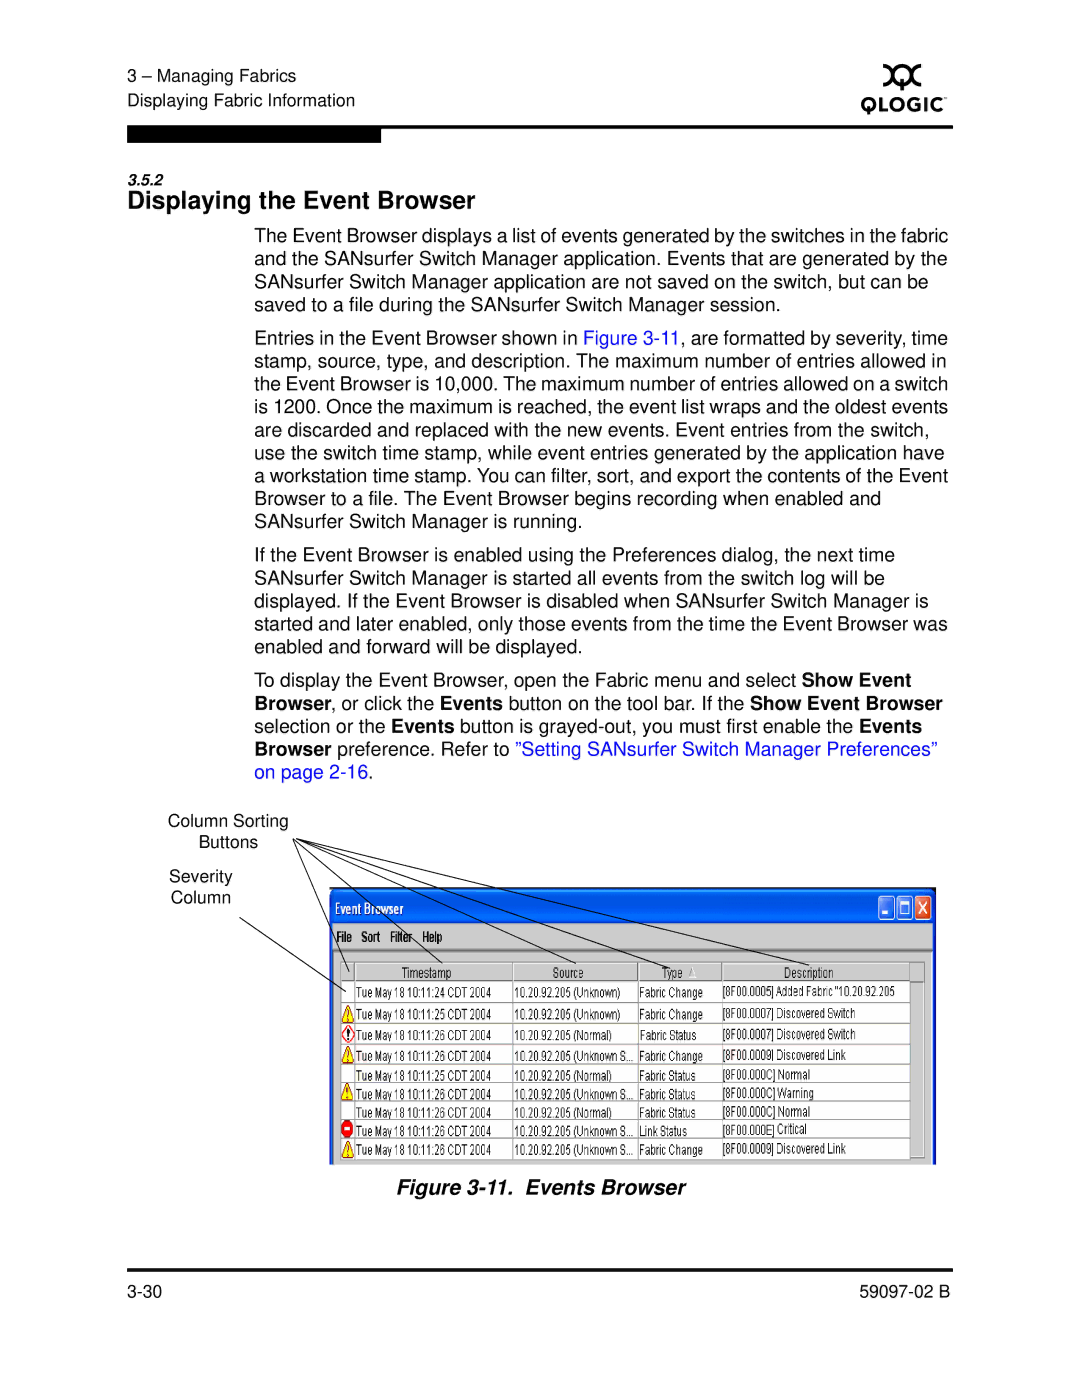
Entries in the Event Browser shown in Figure 3-11, are formatted by severity, time stamp, source, type, and description. The maximum number of entries allowed in the Event Browser is 10,000. The maximum number of entries allowed on a switch is 1200. Once the maximum is reached, the event list wraps and the oldest events are discarded and replaced with the new events. Event entries from the switch, use the switch time stamp, while event entries generated by the application have a workstation time stamp. You can filter, sort, and export the contents of the Event Browser to a file. The Event Browser begins recording when enabled and SANsurfer Switch Manager is running.

If the Event Browser is enabled using the Preferences dialog, the next time SANsurfer Switch Manager is started all events from the switch log will be displayed. If the Event Browser is disabled when SANsurfer Switch Manager is started and later enabled, only those events from the time the Event Browser was enabled and forward will be displayed.

To display the Event Browser, open the Fabric menu and select Show Event Browser, or click the Events button on the tool bar. If the Show Event Browser selection or the Events button is grayed-out, you must first enable the Events Browser preference. Refer to ”Setting SANsurfer Switch Manager Preferences” on page 2-16.

Column Sorting

Buttons

Severity

Column

Figure 3-11. Events Browser

3-30

59097-02 B

Page 76
Image 76
Q-Logic 5600 manual Displaying the Event Browser, Events Browser