Micro Motion
Page
Contents
Using a DeviceNet Tool
Contents
Optional Configuration
Measurement Performance
Appendix a Default Values and Ranges
Micro Motion Model 2400S Transmitters for DeviceNet
Overview
Safety
Before You Begin
Determining transmitter information
1Obtaining version information
DeviceNet functionality
Determining version information
Communication tools
Planning the configuration
1Configuration overview
Pre-configuration worksheet
Flowmeter documentation
Before You Begin Pre-configuration worksheet
Configuration data
2Flowmeter documentation resources
Micro Motion customer service
Bringing the transmitter online
Setting the DeviceNet node address and baud rate
Flowmeter Startup
KBaud
Flowmeter Startup
Using the Transmitter User Interface
User interface without or with display
Using the Transmitter User Interface
1User interface Transmitters without display
Removing and replacing the transmitter housing cover
Using the optical switches
Viewing process variables
Using the display
Display language
Using display menus
3Entering the display menu system
Display password
Entering floating-point values with the display
Select
Scroll to d
Micro Motion Model 2400S Transmitters for DeviceNet
Requirements
Connecting with ProLink II or Pocket ProLink Software
Configuration upload/download
1Service port auto-detection limits
Connecting to a Model 2400S DN transmitter
Service port connection parameters
Connecting via the service port clips
1Serial port connections to service port clips
Protocol Service Port
ProLink II language
Connecting via the IrDA port
Protocol Service Port IrDA Port
Using the DeviceNet device profile
Using a DeviceNet Tool
Connecting to the Model 2400S DN transmitter
Type a tools
Using a DeviceNet tool
Using a DeviceNet Tool
Type B tools
Default assemblies
1Default DeviceNet assemblies
Micro Motion Model 2400S Transmitters for DeviceNet
Characterizing the flowmeter
Required Transmitter Configuration
When to characterize
Characterization parameters
Flow calibration values
Required Transmitter Configuration
1Sensor calibration parameters
Sensor type
How to characterize
2Characterizing the flowmeter
Configuring the measurement units
3Configuring measurement units
Mass flow units
Volume flow units
3Volume flow measurement units Liquid
2Mass flow measurement units
4Volume flow measurement units Gas
M3/MIN
Density units
5Density measurement units
Pressure units
Temperature units
6Temperature measurement units
7Pressure measurement units
MPA
Using the Transmitter
Recording process variables
With ProLink
Using the Transmitter
With the display
Attribute Data Class Instance Type Description
With a DeviceNet tool
1Process data in DeviceNet objects
2Summary of input assemblies
Density fixed Baume units
Mass flow, mass
API average temperature-corrected density
Using the LEDs
Using the module LED
3Module LED states, definitions, and recommendations
Using the network LED
Using the status LED
4Network LED states, definitions, and recommendations
Status LED state Alarm priority Definition
Using ProLink
Handling status alarms
5Transmitter status LED
6Transmitter responses to status alarms
1Viewing and acknowledging alarms with the display
Status window
Click ProLink Status
Alarm Log window
Click ProLink Alarm Log
Using the totalizers and inventories
208772.63
Controlling totalizers and inventories
3Controlling totalizers and inventories with the display
Inventory reset
Object Function Disabled Enabled
To reset an individual totalizer or inventory
To accomplish this Use this device profile data
Using the Transmitter
9Output assemblies used for totalizer and inventory control
Instance ID Data description Size bytes Data type
Micro Motion Model 2400S Transmitters for DeviceNet
Tool Topic Subtopic ProLink DeviceNet tool Display Section
Optional Configuration
1Configuration map
Configuring volume flow measurement for gas
Optional Configuration
Enable the Enter Other Gas Property radio button
Using the Gas Wizard
Click ProLink Configure Flow
Specific Gravity Compared to Air, or Density
1Gas standard volume flow measurement DeviceNet tool
Configuring cutoffs
Configuring the damping values
2Cutoff default values
Cutoffs and volume flow
Cutoff type Default Comments
3Valid damping values
Damping and volume measurement
Configuring the flow direction parameter
Process variable Valid damping values
Defining events
Configuring events
4Effect of flow direction on totalizers and flow values
DeviceNet Type Code Description
5Event types
6Event actions
DeviceNet ProLink II label Display label Code Description
Example
Start Stop
Changing event setpoints from the display
Configuring slug flow limits and duration
Checking and reporting event status
Sec range is 0.0-60.0 sec
Transmitter action if condition occurs
Configuring status alarm severity
Alarm severity levels and fault reporting
8Status alarms and severity levels
Language
Configuring the display
Update period
Enabling and disabling display functions
9Display functions
Configuring the LCD backlight
Parameter Enabled shown Disabled hidden
Display variable Process variable
Configuring the display variables and display precision
10Example of a display variable configuration
Configuring digital communications
DeviceNet node address
DeviceNet baud rate
DeviceNet configurable input assembly
Switch position Baud rate
11Baud rate codes
Modbus address
Modbus Ascii support
IrDA port usage
Digital communications fault action
12Digital communications fault action options
13Device settings
Fault timeout
Configuring device settings
Parameter Description
About the petroleum measurement application
Configuring sensor parameters
Configuring the petroleum measurement application
Terms and definitions
API reference tables
15API parameters
14API reference temperature tables
Configuration procedure
About the enhanced density application
Configuring the enhanced density application
Name Description Density unit Temperature unit
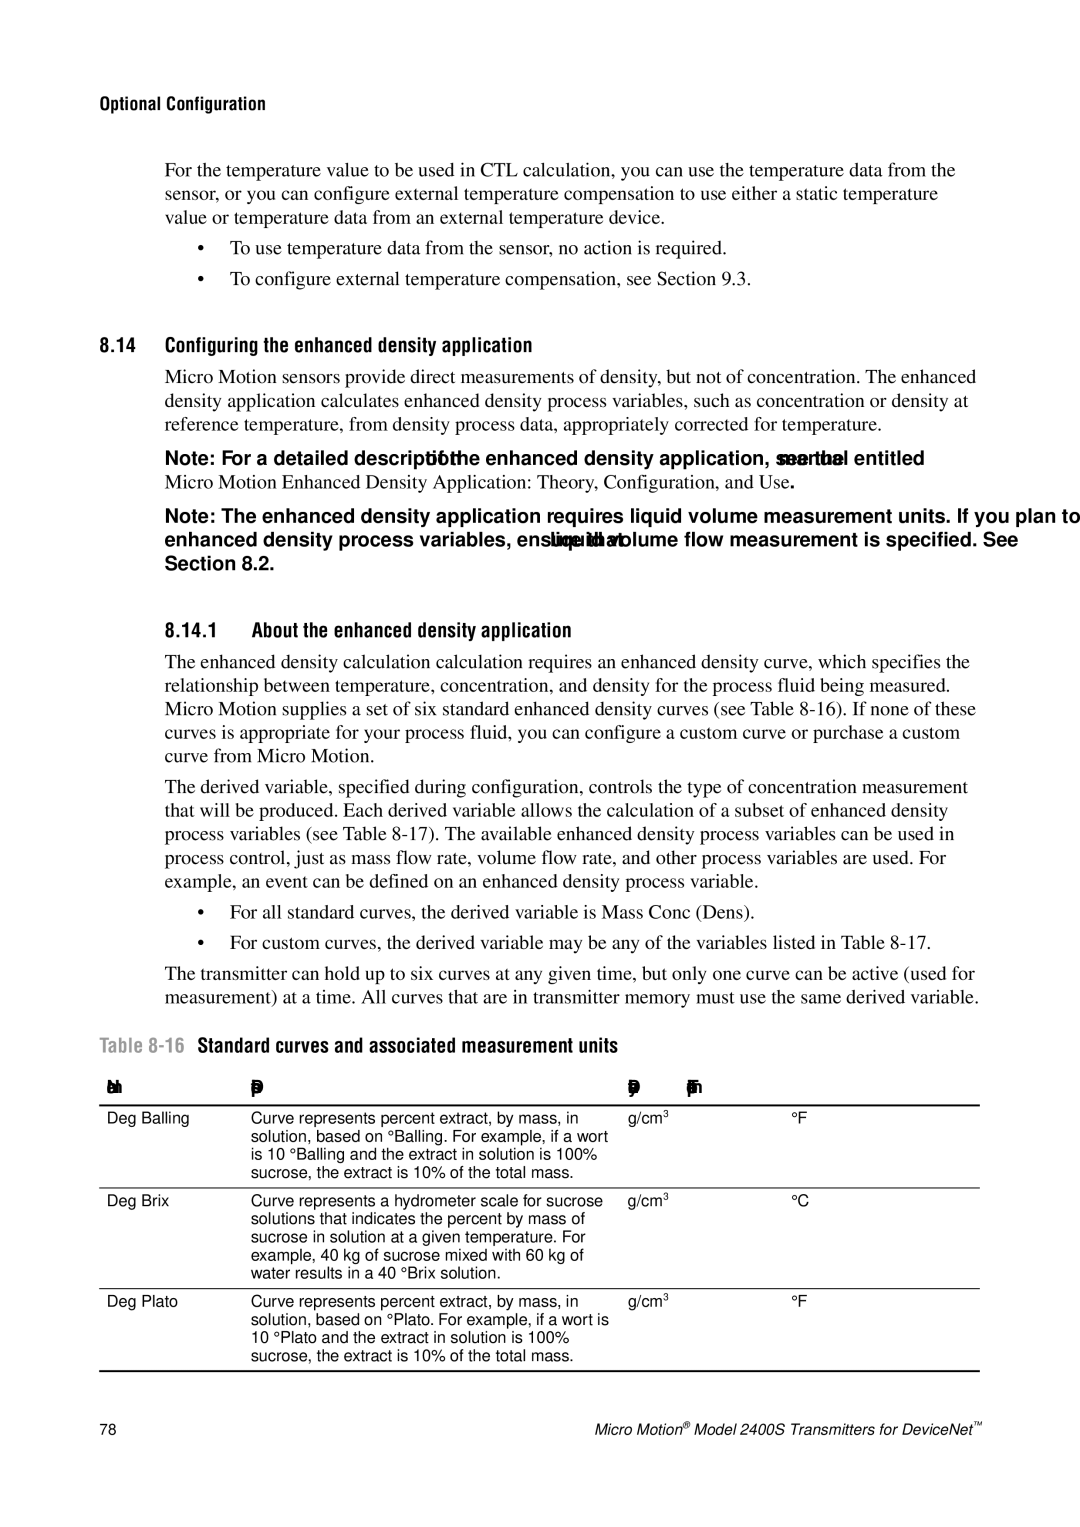
16Standard curves and associated measurement units
17Derived variables and available process variables
Hfcs
Volume Conc SG
3Configuring the enhanced density application DeviceNet tool
Micro Motion Model 2400S Transmitters for DeviceNet
Options
Pressure Compensation Temperature Compensation
Pressure compensation
Pressure correction factors
Configuration
Pressure Compensation and Temperature Compensation
2Configuring pressure compensation with a DeviceNet tool
External temperature compensation
3Configuring external temperature compensation with ProLink
Obtaining external pressure and temperature data
Section See Section
Micro Motion Model 2400S Transmitters for DeviceNet
Measurement Performance
Meter validation, meter verification, and calibration
Calibration
Meter verification
Meter validation and meter factors
Measurement Performance
Comparison and recommendations
Performing meter verification
1Meter verification procedure ProLink
2Meter verification procedure Display menu
3Meter verification procedure DeviceNet tool
1DeviceNet interface for meter verification
Step number Step description Interface
Uncertainty limit and test results
Additional ProLink II tools for meter verification
Performing meter validation
⋅ ExternalStandard
Performing zero calibration
For DeviceNet Device Profile
Zero procedure
Preparing for zero
4Zero button Flowmeter zero procedure
6ProLink II Flowmeter zero procedure
7DeviceNet tool Flowmeter zero procedure
Performing density calibration
Sensor requirements
Density calibration procedures
Preparing for density calibration
Density calibration fluids
8D1 and D2 density calibration ProLink
9D1 and D2 density calibration DeviceNet tool
10D3 or D3 and D4 density calibration ProLink
11D3 or D3 and D4 density calibration DeviceNet tool
Performing temperature calibration
12Temperature calibration ProLink
110
1Troubleshooting topics and locations
Troubleshooting
Guide to troubleshooting topics
Section Topic
Transmitter does not communicate
Troubleshooting
Transmitter does not operate
Checking the communication device
Diagnosing wiring problems
Checking the DeviceNet cable and connector
ProLink
Zero or calibration failure
Fault conditions
Simulation mode for process variables
Transmitter LEDs
Alarm ProLink Code Message Cause Suggested remedy
Status alarms
2Status alarms and remedies
A012 Zero Too High See A10
PIC UI Eeprom
Checking process variables
3Process variables problems and remedies
Symptom Cause Suggested remedy
120
Checking slug flow
Checking the characterization
Checking the flow measurement configuration
Checking the sensor tubes
Checking the calibration
Evaluating the test points
Obtaining the test point values
4Test points with DeviceNet tool
5Sensor pickoff values
Low pickoff voltage
Drive gain problems
6Drive gain problems, causes, and remedies
7Low pickoff voltage causes and remedies
Checking sensor circuitry
2Exploded view of transmitter and connection to sensor
8Nominal resistance ranges for flowmeter circuits
Circuit Pin pairs Nominal resistance range1
4Feedthrough pins
9Sensor and cable short to case causes and remedies
130
Table A-1Transmitter default values and ranges
Default Values and Ranges
Most frequently used defaults and ranges
Type Setting Default Range Comments
Default Values and Ranges
Configuration and Use Manual 133
134
Menu Flowcharts
Version information
Menu Flowcharts
Figure B-1ProLink II main menu
Figure B-2ProLink II configuration menu
Figure B-3ProLink II configuration menu
Figure B-4Display menu Off-line menu, top level
Figure B-6Display menu Off-line maintenance Configuration
Figure B-7Display menu Off-line maintenance Zero
142
Appendix C
Device Profile
Attrib Name Data type Service Mem Description Comments
Device Profile
Table C-3Analog Input Point Object 0x0A Instance 3 density
Gas Standard Volume Object
Table C-5Gas Standard Volume Object 0x64 Instance
Calibration Object
Table C-6Calibration Object 0x65 Instance
Diagnostics Object
Table C-7Diagnostics Object 0x66 Instance
Configuration and Use Manual 151
0x0200 = D4
Get Collection of status bits
=UI Prom
Set Entry in the alarm Range Index History log Alarm history
156
Configuration and Use Manual 157
158
Sensor Information Object
Table C-8Sensor Information Object 0x67 Instance
Local Display Object
Table C-9Local Display Object 0x68 Instance
Table C-10API Object 0x69 Instance
API Object
CTL Real
Table C-11Enhanced Density Object 0x6A Instance
Code Description
Measurement unit codes
Process variable codes
Alarm index codes
Alarm index codes
Table C-16
Table D-1Display codes used for display variables
Display Codes and Abbreviations
Codes and abbreviations
Code or abbreviation Definition Comment or reference
Table D-2Display codes used in off-line menu
Display Codes and Abbreviations
Enabl
172
Index
Index
See EDS
MAC ID
See also Display
178
Page
MMI-20007739