Control Panel Display Options
The controls in the panel enable the histograms to be displayed in different colour modes and as either a line or as a bar chart. You can also set the vertical scaling used for the histograms.
Colour Mode
The possible colour modes (selectable either from the Colour mode drop down in the panel or from the Colour mode menu) are:
YCbCr | Histograms are generated in YCbCr space |
YCbCr (SD) | As above but after conversion to true SD levels |
RGB | Histograms are generated in RGB space |
Composite | Histograms are generated in Composite colour space |
Items may be displayed stacked vertically above each other (as shown here) or in parade form. In addition, selector boxes are associated with each of the above modes so that a subset of the items can be displayed if required.
Graph Type
The different graph types available are Bar, Line and Line (All). The last of these three options shows a single combined histogram.
Vertical
The vertical range sets the scale of the graph, and can be adjusted to suit your exact data. For most data, the best results will be obtained by ticking the Log button, which applies a logarithmic scaling to the vertical axis. Clicking the Auto button (after ticking or clearing Log) provides an easy way of selecting a suitable scale.
Options menu
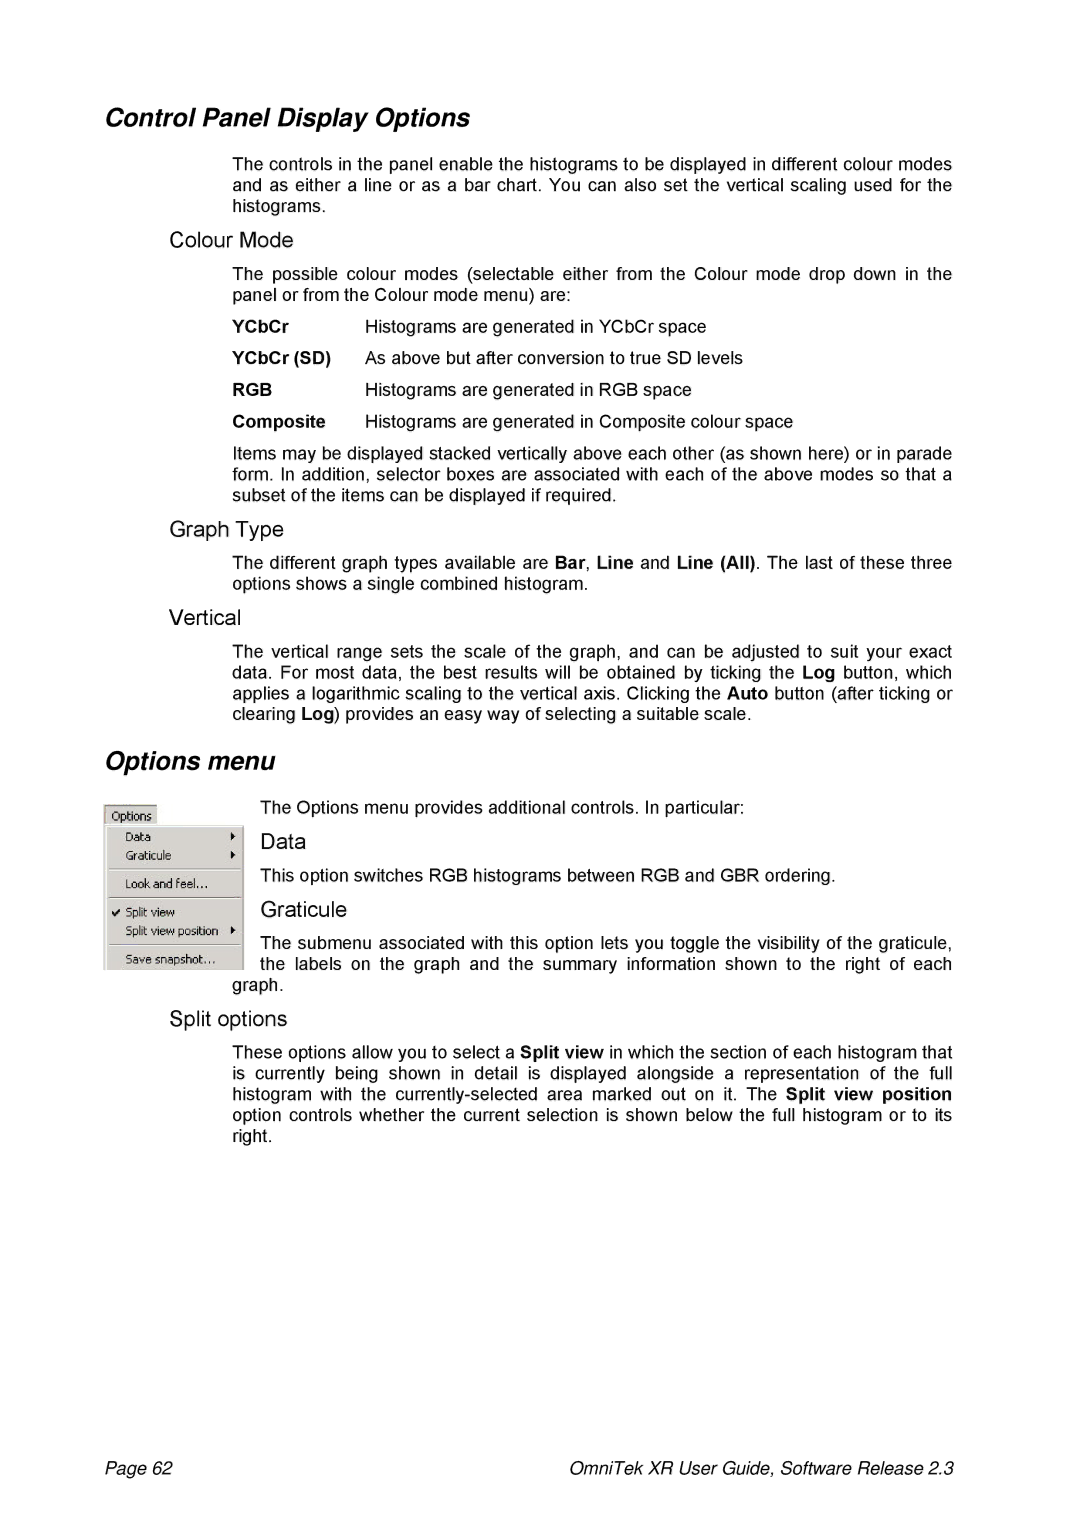
The Options menu provides additional controls. In particular:
Data
This option switches RGB histograms between RGB and GBR ordering.
Graticule
The submenu associated with this option lets you toggle the visibility of the graticule, the labels on the graph and the summary information shown to the right of each
graph.
Split options
These options allow you to select a Split view in which the section of each histogram that is currently being shown in detail is displayed alongside a representation of the full histogram with the
Page 62 | OmniTek XR User Guide, Software Release 2.3 |
