Operation Verification | Measurements |
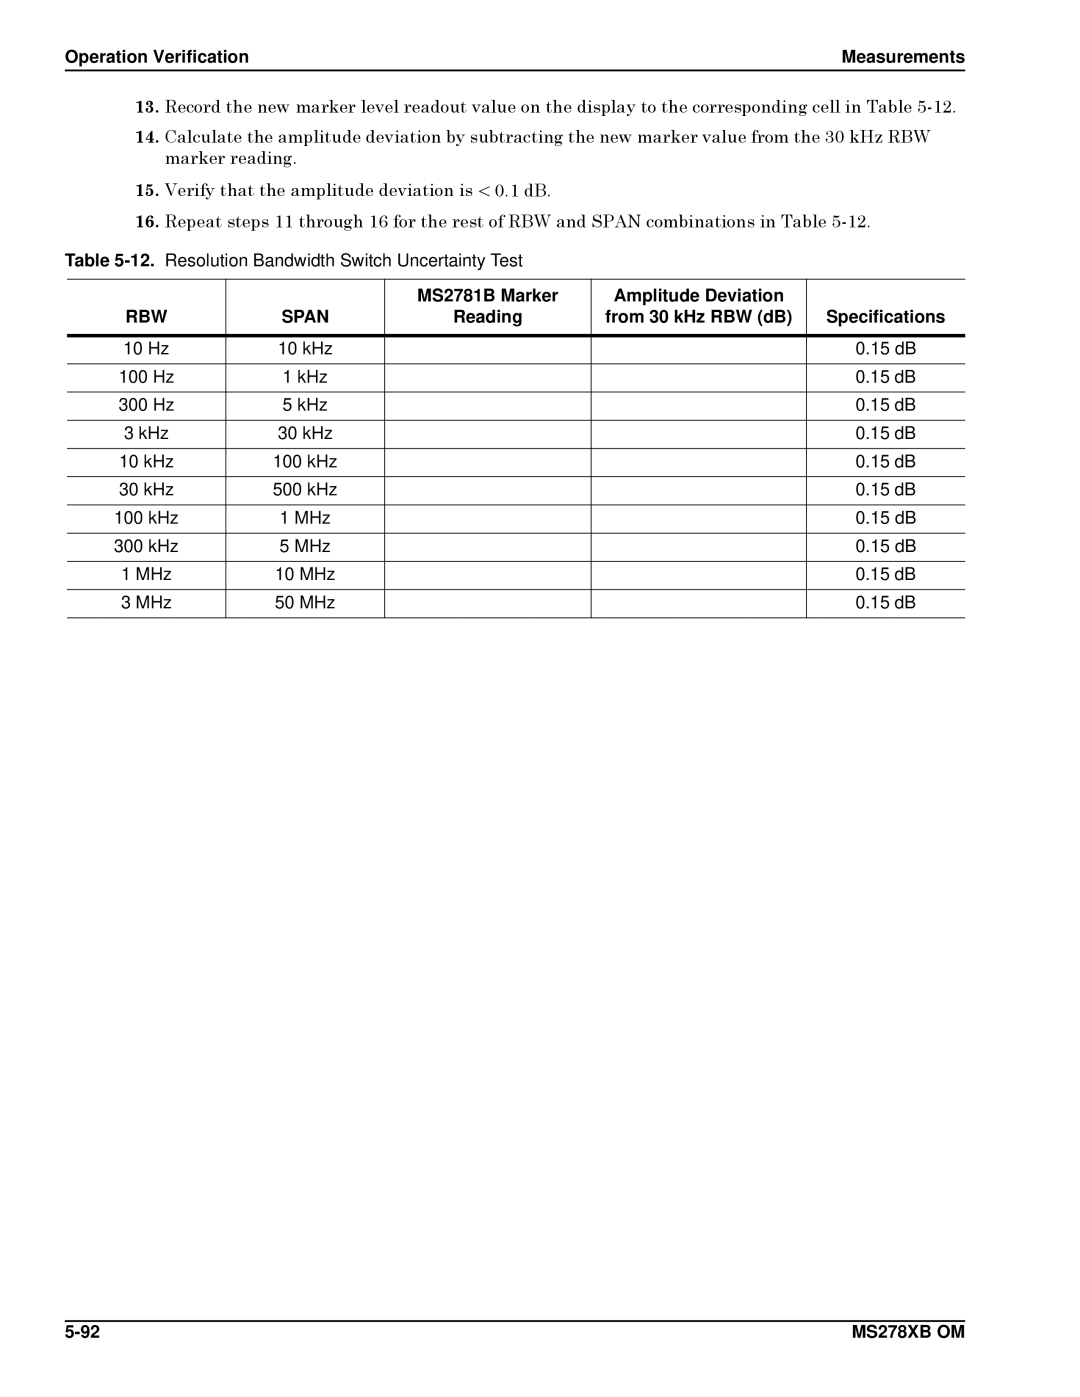
13.Record the new marker level readout value on the display to the corresponding cell in Table
14.Calculate the amplitude deviation by subtracting the new marker value from the 30 kHz RBW marker reading.
15.Verify that the amplitude deviation is < 0.1 dB.
16.Repeat steps 11 through 16 for the rest of RBW and SPAN combinations in Table
Table
|
| MS2781B Marker | Amplitude Deviation |
|
RBW | SPAN | Reading | from 30 kHz RBW (dB) | Specifications |
|
|
|
|
|
10 Hz | 10 kHz |
|
| 0.15 dB |
|
|
|
|
|
100 Hz | 1 kHz |
|
| 0.15 dB |
|
|
|
|
|
300 Hz | 5 kHz |
|
| 0.15 dB |
|
|
|
|
|
3 kHz | 30 kHz |
|
| 0.15 dB |
|
|
|
|
|
10 kHz | 100 kHz |
|
| 0.15 dB |
|
|
|
|
|
30 kHz | 500 kHz |
|
| 0.15 dB |
|
|
|
|
|
100 kHz | 1 MHz |
|
| 0.15 dB |
|
|
|
|
|
300 kHz | 5 MHz |
|
| 0.15 dB |
|
|
|
|
|
1 MHz | 10 MHz |
|
| 0.15 dB |
|
|
|
|
|
3 MHz | 50 MHz |
|
| 0.15 dB |
|
|
|
|
|
MS278XB OM |