Instrument Overview | Graphical User Interface Overview |
Table
Index | Description |
1Input Status: Indicates ADC overload and L.O. unlock.
2Sweep Status: Displays the sweep status of Triggered and Single sweep modes.
3Trace Display: Vector trace data is displayed in Yellow.
4
5
6Center Frequency: Indicates the center frequency of the sweep. If a frequency offset is set, OFFSET is also displayed.
7Marker Information: Displays the Symbol and I and Q magnitude.
8Error Data: Displays the error vector magnitude, carrier frequency error, and symbol rate error.
9Symbol Rate: Displays the current symbol rate
10Amplitude Setup: The amplitude setup field displays the current attenuation level and reference level. If the attenuation is set manually, an asterisk is displayed.
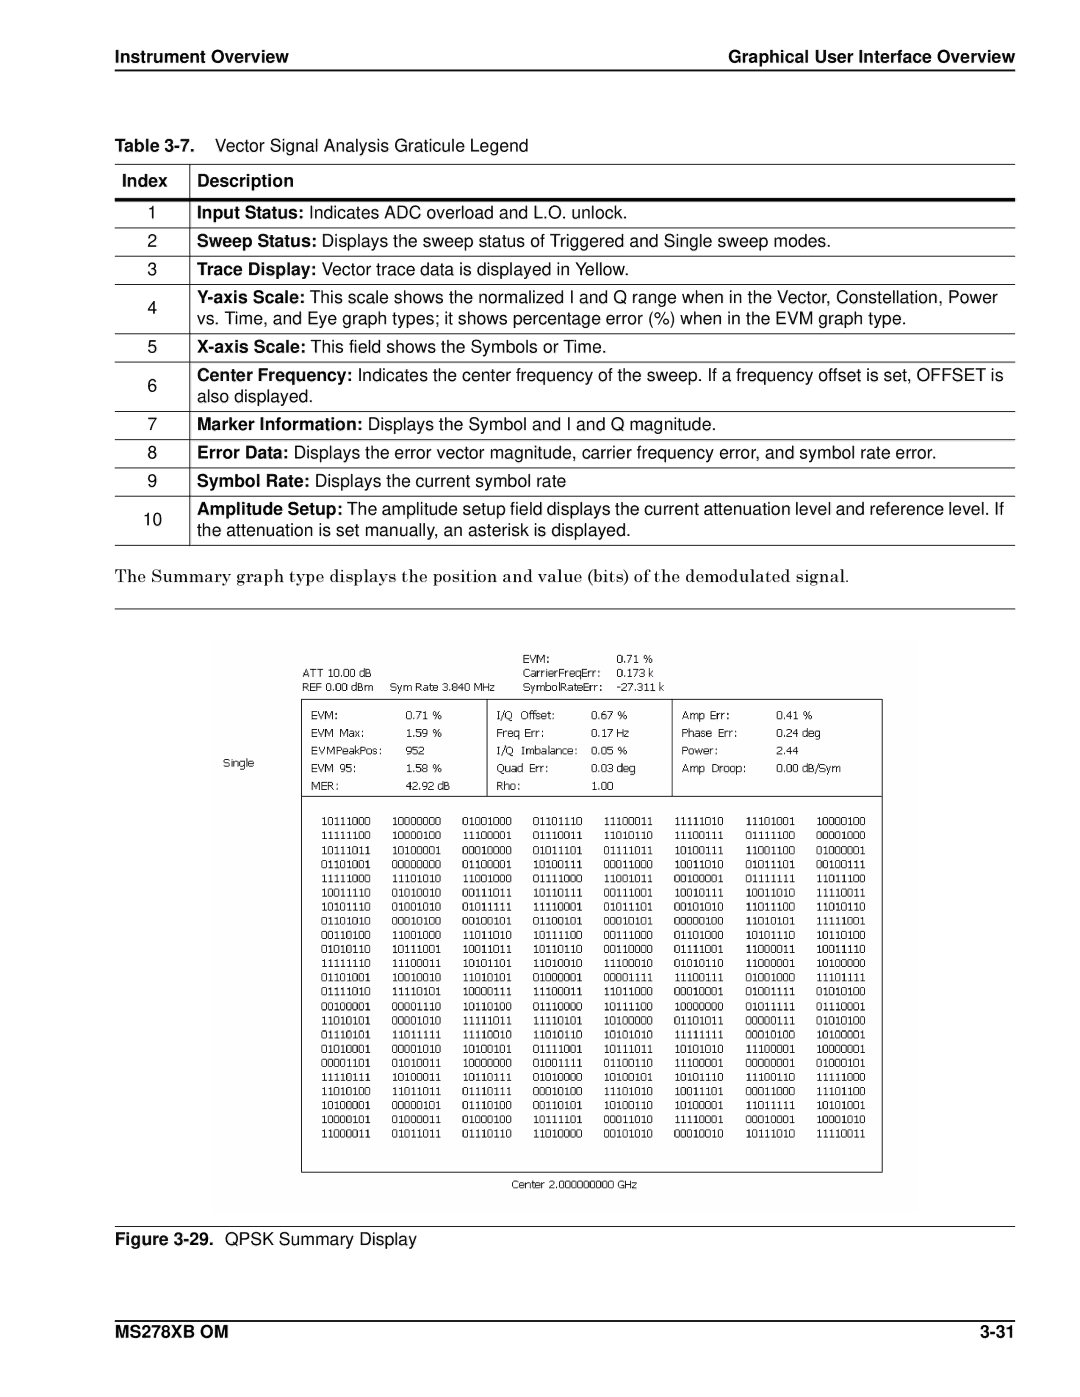
The Summary graph type displays the position and value (bits) of the demodulated signal.
Figure 3-29. QPSK Summary Display
MS278XB OM |
