Qvwuxphqw
Trademarks
III
About this Manual What this Manual Contains
Initializing the CombiScope Instrument
Measuring Signal Characteristics
Readout of measurement data
15.4.2 Error-reporting using the SRQ mechanism
15.1.1
15.1.2
Application Program Examples . . . . . . . . . . . . . A-1
Command Reference
VII
About this Manual
What this Manual Contains
About this Manual
Preparations for Scpi Programming
System setup
Getting Started with Scpi Programming
Programming environment
Commands
Command
Addresslist
Constant -1 Ffff hex
Programming Note
Program Example
How to identify the CombiScope instrument
How to reset the CombiScope instrument
How to switch between digital and analog mode
Initializing the CombiScope Instrument
’Requests for error
Error Reporting
Channels and memory registers Example Send -- FORMat INT,16
Acquiring Traces
Format of the trace response data is as follows
Example
How to acquire a single shot trace
Preparations
This string data
Connect a probe from the Probe Adjust signal to channel
How to acquire repetitive traces
CONFigure + READ?
Measuring Signal Characteristics
MEASure?
INITiate + FETCh?
How to make repeated measurements
How to make a single shot measurement
Introduction
Using the Combiscope Instruments
Using the Combiscope Instruments
TRACe? CH1
Fundamental Programming Concepts
SAV
RCL
DISPlayMENU TRIGger
SYSTemKEY
Measurement instructions
Explanation of the Instrument Model
Single function programming using the instrument model
Read ← blockdata Instrument setup
Instrument setup
Front panel simulation
MEASureAC?
MEASure? query
Benefits of using parameters
Voltageparameters = expectedvoltage,resolution
Generic form of a measurement instruction is as follows
MEASureAMPLitude?
Examples
MEASureVOLTageAMPLitude? 10, @2
MEASureVOLTageFREQuency? 10E6, @3
Waveform measurements
Pulse characteristics
MEASureRISETIME? 20,80
MEASureFALLTIME? @3
Measurefunctionmeasureparameters
FTIMe = alias for Falltime RTIMe = alias for Risetime
CONFigureAC
Customizing settings
SENSeAVERage on
SENSeAVERageCOUNT
CONFigureRISETIME
READRISEOVERshoot?
Multiple measurements
READFREQuency?
Multiple characteristics from a single acquisition
Starts Acquisition Returns
Starts a Next acquisition Returns New Frequency result
TRIGgerSOURce BUS
Trigger control via Gpib
INITiate
FETChAC?
M12,CH2
Fetching characteristics from memory traces
Acquisition control
Acquisition
Using the Combiscope Instruments
Trigger Type
Triggering
Trigger Source
Trigger Level
Trigger Coupling
Trigger Slope
DC Coupling 0 Hz cutoff frequency
DC Coupling
AC Coupling 10 Hz cutoff frequency
LF-REJECT 30 KHz cutoff frequency
HF-REJECT 30 KHz cutoff frequency
Video triggering
Lines per frame
Ntsc
PAL
Secam
OFF
Trigger modes
Line
BUS
State Description
Commands
Trace
Pre- and post-triggering
External triggering
10 The trace acquisition flow
Reading trace acquisitions
Repetitive acquisitions
Single-shot acquisition
11 Relation between screen position and trace value
Conversion of trace data
’Array of 512 integers
Byte1 = ASCMID$response$, J
Ps = Ts
For 8-bit sample traces
Ps = Ts / 25600 * 100 = Ts
’1-byte samples
Using the Combiscope Instruments Program Example
AVGn = ∑X1 + .. + Xn ⁄ n
Averaging Acquisition Data
13 The Trigger Model during acquisition averaging
Programming tip
Channel Selection
1 AC/DC/ground coupling
Signal Conditioning
Input impedance
Input filtering
Input polarity
Vertical range and offset
Vs = Ts / 200 * PTPeak OFFSet
Autoranging attenuators
Limitation
Number of samples
Time Base Control
Time base speed
MTB = 50 * SENSeSWEepTIME / TRACePOINts
Real time acquisition
Ts = sampleindex * SENSeSWEepTIME / TRACePOINts
Autoranging time base
16 Definition of a signal period
Post Processing
How to do post processing
Select the source for the post processing function
Send → CALCulateFEED M21 ’M21 = source for CALC1
Mathematical calculations
Standard Available
Math
Optional
Check the result of the post processing function
Example Send → TRACe? M21
Read ← tracebuffer ’Reads M21 trace
Differentiating and integrating traces
Mathematical calculations
Frequency domain transformations
Relative FFT
Absolute FFT
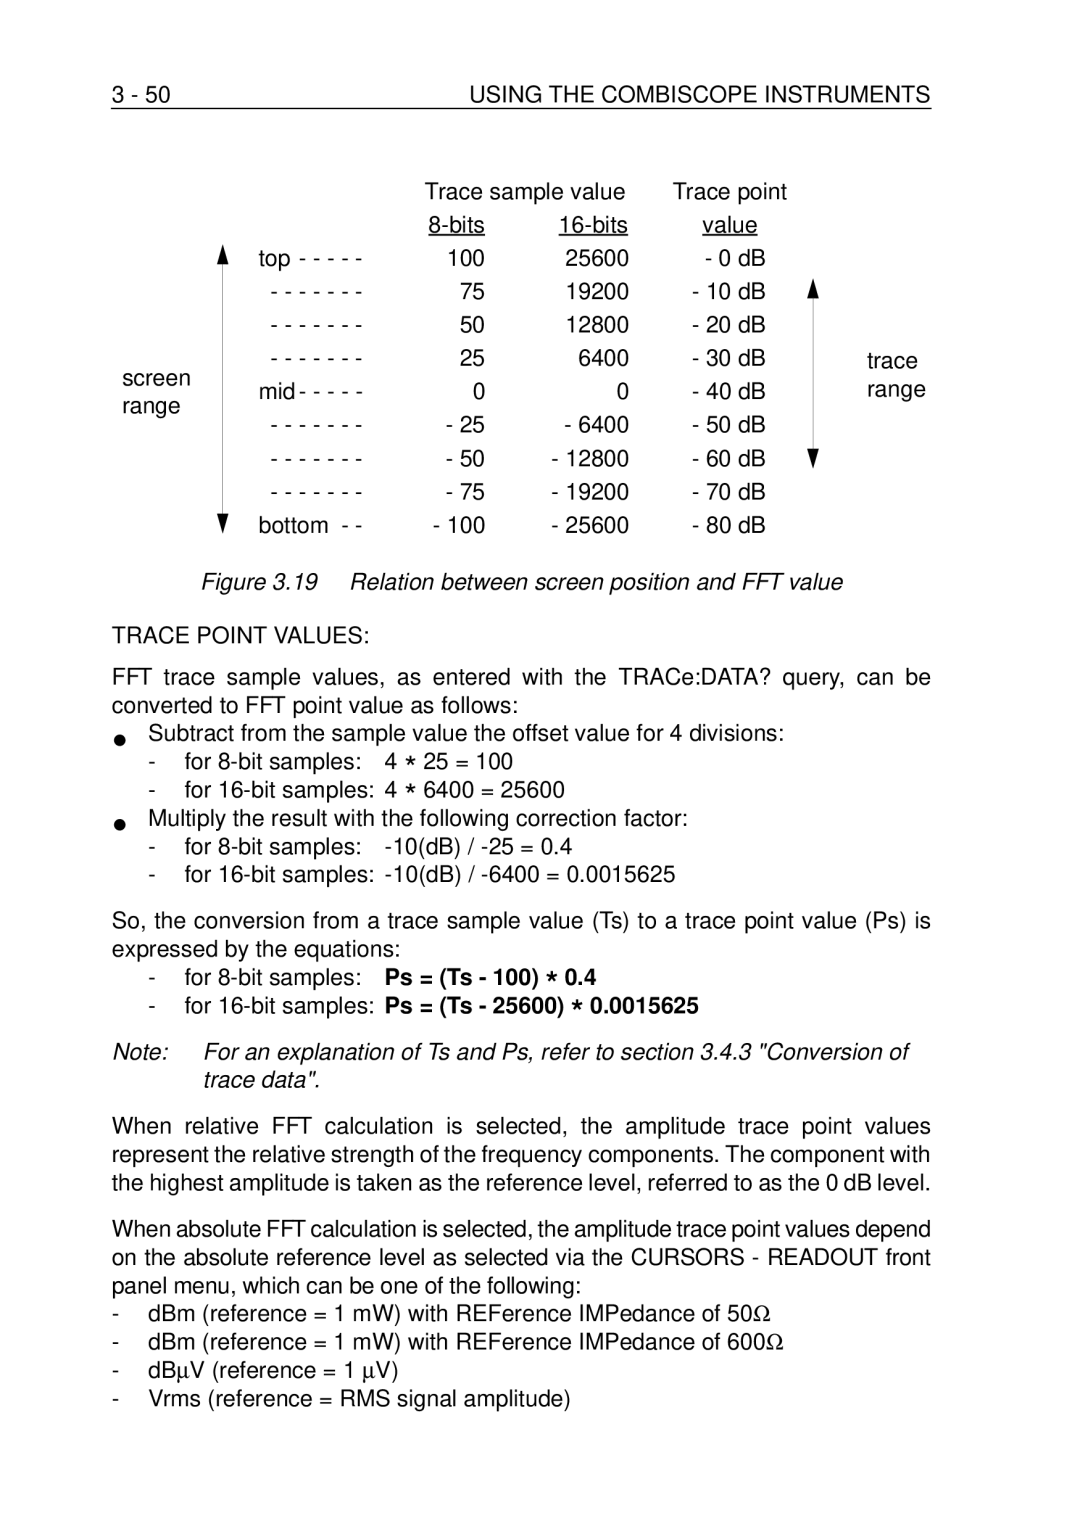
Trace Point Values
For 16-bit samples Ps = Ts 25600
Trace data
This can be calculated as a signal level
Example for attenuator setting 0.5 V/div
Vrms offset calculation
DBm 600Ω offset calculation
DBm 50Ω offset calculation
DBμV offset calculation
DBμV = 1 μV 1.0E-6 V at 50Ω impedance
Setting
Trace Point Frequencies
Fs = sampleindex * 1250 / TRACePOINts * MTB
Program Example
Histogram functions
Amplitude belt = peak-to-peak range
Frequency filtering
20 Trace memory control
Trace Memory
PM33x0B 512 +EXT
Channels Memory Registers Standard
Extended
Trace formatting
Copying traces to memory
Send → TRACe? CH3
Writing data to trace memory
’Queries for CH3 trace
Read ← trace block
Reading data from trace memory
Brightness control
Screen/Display Functions
Display functions
Menu
MEAS1/MEAS2 Data
Measurement Value
Meastype,measvalue,suffixunit
Description
Cursors Data
Type Unit Description
Math FFT Data
Call Send0, 8, DISPlayMENU MEASure
Display of user-defined text
Program Example 2 text as block data
Selection of softkey menus
Device Type
Print/Plot Functions
Hpgl
Hplaser
22 Hardcopy of screen on printer/plotter
Auto Calibration
Real-Time Clock
= okay
Status data for the CombiScope instruments
Status Reporting
Operation status data
Digital mode
CALibrating
RANGing
Questionable status data
TEMPerature
VOLTage
CALibration
Status Register Data Structure Preset Value
How to reset the status data
Program example using the status byte STB
How to enable status reporting
’Defines SRQ-routine
Error-reporting routine
How to report errors
’Sends error query
How to restore initial settings
Saving/Restoring Instrument Setups
How to save/restore a setup via instrument memory
How to save/restore a setup via the Gpib controller
Front Panel Simulation
How to simulate the pressing of a front panel key
Row 201
Row 801
Autoset Simulation
How to simulate the operation of a softkey menu
Envelope
Functions not Directly Programmable
DISPlayMENU ACQuireSYSTemKEY 3 toggles on/off
MULTiple-shot
Meta symbols
Syntax specification notations
Non-terminal symbols
Terminal symbols
Not contain the message element
Default
Between the square brackets, without
MEASureVOLTageDC? is the same
Data types
An explicit decimal point and may or may not be
Preceded by a sign, e.g
Double quotes
Bit codes
Examples This is a string
’This also’
Command Summary
Gate
Feed
Menu Name
Command Reference Parameters
State
DATA?
Read
Auto
TYPE?
RTS
DTR
Baud
Bits
Type PAL Secam Ntsc Hdtv
ALL
Timeresolution
Expectedvoltage ,resolution
Measurefunction Measureparameters
Referencelow ,referencehigh,expectedtime
Command Descriptions
Errors
Front panel compliance
Specifies the compliance with front panel operations
Syntax *CAL? Response 0
CAL? CALibration
Calibration okay Calibration not okay
Limitation
Clear Status
16COMMAND Reference
Byte Register. Alternative commands *ESE #B10001
Event Status Enable
Ation Complete bits to be summarized in the Status
*ESE #H11
Event Status Register
18COMMAND Reference
Response Integer Description
PON URQ CME EXE DDE QYE RQC OPC ESR
Syntax *IDN?
IDN? Identification
Operation Complete
20COMMAND Reference
Query form *OPC? Response Description
Restrictions
Ieee EXT EM MP
OPT? Option identification
Recall instrument setup
22COMMAND Reference
Syntax RCL numericdata Description
RST Reset
Function Default Settings
Syntax *RST Description
Measure 1
Beeper Hardcopy Print & Plot Plotter Hpgl Pass/Fail testing
Math 1
Cursors
Syntax SAV numericdata Description
Save instrument setup
Service Request Enable
26COMMAND Reference
Request Enable Register
Syntax STB? Response Integer Description
STB? Status Byte
Syntax *TRG Description
TRG Trigger
TST? Self-test
Syntax *TST? Response 0
Self-test okay Self-test not okay
Command Reference
ABORt
Configures for AC-RMS value
Syntax ABORt Description
Aborts the current acquisition
Switches the differentiate
CALCulatenDERivativePOINts CALCulatenDERivativeSTATe
Function on
CALCulatenFEED
Filter function turned off Filter function turned on
Integrate function turned off Integrate function turned on
CALCulatenINTegralSTATe
CALCulatenMATHEXPRession
Switches MATH2 function on
CALCulatenMATHSTATe
Switches MATH1 function on
Response ABS REL
Query form CALCulatenTRANsformFREQuencyTYPE?
Switches MATH2-FFT on
Selects relative MATH2-FFT calculation
Selects MATH2-FFT-HANNing window
Switches
CALCulatenTRANsformHISTogramSTATe
Histogram function turned off Histogram function turned on
CALibrationALL
Syntax CALibrationALL Query form CALibrationALL?
Response 0 Description
Starts auto calibration
Reads condition register
Conditions
CONFigure
Syntax CONFigureVOLTagemeasurefunction
Syntax elements are specified with the MEASure? query
Expected voltage 600 mV
Signal on channel
Channel 2 AC coupled
Initiates + fetches AC-RMS
Query form DISPlayBRIGhtness? MINimum MAXimum
DISPlayBRIGhtness
Response NR3
NR30.00E00 .. .00E00
DISPlayMENUNAME
Switches TB Mode menu display on
DISPlayMENUSTATe
Display turned off Display turned on
DISPlayWINDow1TEXTnDATA?
Type Analog Mode Digital Mode
Syntax DISPlayWINDow1TEXTnDATA?
Response is peak-peak value of 608.4 mV MEAS1
Display on
Clears all user text
DISPlayWINDow2TEXT1CLEar
As text
DISPlayWINDow2TEXT1DATA
Sends 25 decimal
Character byte
Command Reference
DISPlayWINDow2TEXT1STATe
FETCh?
54COMMAND Reference
FETChVOLTagemeasurefunction?
Voltageparameters, measureparameters
Restrictions
Acquisition
INT,8
FORMatDATA
HCOPyDATA?
HCOPyDEVice
Response 1
INITiateCONTinuous
Syntax INITiateIMMediate
INITiateIMMediate
Trigger level becomes
Single shot acquisition
INPutnCOUPling
Response 2.00E+07
INPutnFILTerLPASsSTATe INPutnFILTerLPASsFREQuency?
Query form INPutnFILTerLPASsSTATe?
Common low pass filter off Common low pass filter on
After a *RST command, the impedance is 1 MΩ
INPutnIMPedance
Syntax INPutnIMPedance NRf MINimum MAXimum 1E6
Response Norm INV Description
INPutnPOLarity
Response DIG Anal
INSTrumentNSELect INSTrumentSELect
DIG
Anal
MEASure?
Channellist =
Measurefunction measureparameters
High
Falltime
First falling edge equals the REFerence MIDDle until
Signal. The peak to peak value is the difference between
PDUTycycle Referencemiddle
Ratio percentage of the positive width PWIDth
Measureparameters
Risetime
Frequencyresolution = NRf DEFault
Executed. The unit of timeresolution is second
Referencemiddle is volt Expectedperiod = NRf DEFault
Periodresolution = NRf DEFault
Limitations
Description
Syntax READVOLTagemeasurefunction?
74COMMAND Reference
Example
SENSeAVERageSTATe
Syntax SENSeAVERageCOUNt NRf 8 16 SENSeAVERageTYPE?
SENSeAVERageCOUNt SENSeAVERageTYPE?
Response Scal
Initiates trace averaging
Addition of channel i+j is off Addition of channel i+j is on
SENSeFUNCtionOFF SENSeFUNCtionON SENSeFUNCtionSTATe?
Limitations
SENSeSWEepOFFSetTIME
SENSeSWEepPDETectionSTATe
SENSeSWEepREALtimeSTATe
Real-time mode switched off Real-time mode switched on
Slope = either pos. or neg
Reads AC-RMS
SENSeSWEepTIME
MTB values in the digital mode
Query form SENSeSWEepTIME? MINimum MAXimum
Base range is limited to 10 μs non-alternating time base
Requests sweep time
Coupled values
Reads sweep time
Requests nr of trace points
SENSeSWEepTIMEAUTO
Autoranging MTB switched off Autoranging MTB switched on
Sets trigger source CH1
Sets autoranging MTB on
Switches CH2 on
Switches CH1 on
SENSeVOLTagenDCRANGeAUTO
Autoranging CH2
Channel
SENSeVOLTagenDCRANGeOFFSet
Query form SENSeVOLTagenDCRANGePTPeak? MINimum MAXimum
SENSeVOLTagenDCRANGePTPeak
Sensitivity = 0.8 / 8 =
Peak-to-peak =
100 mV/div
Trigger source =
Response NR1 Description
BIT Decimal Meaning Number Value
Syntax STATusPRESet
STATusPRESet
Following table defines the effect of STATusPRESet
Status Register Filter / Enable Preset Value
Response NR1 Description
Returned value 16 equals bit 4 set temperature too high/low
TEMPerature too high or too low
Enables report of TEMPerature too high/low 0
Enables report of TEMPerature within allowed limits 1
Error number is -222 and the meaning is Data out of range
No error
STATusQUEueNEXT?
350,Queue overflow
Reads the error queue
Beeper disabled Beeper enabled
Beeps on error
SYSTemBEEPer SYSTemBEEPerSTATe
Wire control
Response on Stan
Stan
None
XON
Even ODD None
Response 7
No X-on/X-off handshaking
Response XON None
1200
Becomes
Sets the system date to Nov 7
SYSTemDATE
SYSTemERRor?
Response NR1
SYSTemKEY
Front Panel KEY
Returns the last key simulation
Enables Utility softkey menu
SYSTemSET
Nodenr nodelength firstbyte ... lastbyte
SYSTemTIME
SYSTemVERSion?
*RST command doesn’t change the current Scpi version
Syntax SYSTemVERSion?
Response YYYY.V
TRACeCOPY
Response definiteblock
TRACeDATA
Initiates single acquisition
Reads channel 1 trace
Requests channel 1 trace
Queries peak-to-peak
Reads peak-to-peak
TRACePOINts
Number of trace points for all
Requests M23 trace
Reads M23 trace
Sets high-pass filter off
Pass Boolean
Sets high-pass filter on
Low-pass filter active High-pass filter active HF-reject
Filter Frequency LOW-PASS on HIGH-PASS on
Automatically switches
DC coupling HF-reject AC coupling KHz LF-reject
Low-Pass filter off
TRIGgerSEQuence1FILTerLPASsSTATe Boolean
TRIGgerSEQuence1FILTerLPASsFREQuency NRf
TRIGgerSTARtFILTerLPASsFREQuency NRf
TRIGgerSTARtFILTerLPASsSTATe Boolean
Filter
Frequency LOW-PASS on HIGH-PASS on
Sets cutoff frequency = 30 KHz
TRIGgerSEQuence1HOLDoff TRIGgerSTARtHOLDoff
TRIGgerSEQuence1LEVelAUTO Boolean
TRIGgerSEQuence1LEVel NRf MINimum MAXimum
TRIGgerSTARtLEVel NRf MINimum MAXimum
TRIGgerSTARtLEVelAUTO Boolean
Channel Continuous initiation
Trigger source Becomes
Div. sensitivity
Trigger level becomes 0.2
TRIGgerSEQuence1SLOPe TRIGgerSTARtSLOPe
After a *RST command, the trigger slope is POSitive
POS
NEG
Sets real-time mode on
Configures AC-RMS CH2
Triggering is done at positive
Rising and negative falling
TRIGgerSEQuence1SOURce TRIGgerSTARtSOURce
IMM
EXT
Input channel 1 becomes
Configures AC-RMS CH1
Trigger source
Single initiation
TRIGgerSEQuence1TYPE TRIGgerSTARtTYPE
Edge
Selects edge triggering
Numb
Selects lines triggering
Selects TV video
Linenr = linenr + 625/2 linenr = linenr 625/2
Selects video lines
Selects video line
Scam Secam
Secam Ntsc Hdtv
Scam
Lines/frame Selects
Selects
Lines/frame Selects Secam
Lines/frame Selects Hdtv
Response POS NEG
Positive video signal polarity selected
PAL or Secam From 1 to
123 Selects Negative Video Signal polarity
Making a Hardcopy of the Screen Pass/Fail Testing
Error reporting is invoked as follows Call errorcheck
Application Program Examples
Application summary
Making automatic measurements
FETChNWIDth?
Application program
’Termination Receive on EOI
Making programmed measurements
Reading measurement values
Acquiring Waveform Traces
Save/recall settings to/from internal memory
Saving/Recalling Instrument Setups
Application summary
Application program
Making a Hardcopy of the Screen
CombiScope Instrument
Ieee
Saving a pass/fail test setup
Pass/Fail Testing
Application program Restoring a pass/fail test setup
DISPlayMENU MEASure
Running a pass/fail test
Cross Reference Front Panel Keys / Commands
Cross References
Channel 4 is external trigger input for PM33x0B
Page
Acquire menu
Cross Reference Softkey Menus / Commands
Cursors menu
Programmable with the *SAV/*RCL and Systset commands
Ext instead of ch4 for PM33x0B
Display menu
Other functions with RCL/SAV and Systset
Mathplus Math menu
Yes no
Page
DTB DEL’D TB menu
Measure menu
SAVE/RECALL menu
Setups menu
Systset RCL/SAV
TB Mode menu
Trigger menu
Analog Mode
Logic
Utility menu
Wire
Ieee
Inpfilt Onoff INP1IMP INP2IMP INP3IMP INP4IMP
Vertical menu
Cross Reference Functions / Commands
Average
Function + KEYS/MENUS Related Scpi Commands Autoset
BW Limit
Calibration Autocal
Delay Measurement
Delay
Delayed Timebase DEL’D TB
Differentiate Mathplus
Histogram Mathplus
FFT ON/OFF
Hold OFF
CH1
Logic Trigger
Integrate Mathplus
Magnify Horizontal
Main Time Base
Pass Fail Testing Mathplus SAV, *RCL
Function + KEYS/MENUS Related Scpi Commands Mathematics
Power Supply
Measure Menu
Remote Setup
Remote Control IEEE-488.2
Remote Control RS-232
Probe Utilities
Status Screen
Function + KEYS/MENUS Related Scpi Commands
Subtract Mathematics
Text OFF
Single
Trig
Multi
Roll
Trigger DEL’D TB
Trigger Coupling
Trigger Level
Trigger Main TB
User Text
Util Menu
Util Screen & Sound
DISPlayWINDow1TEXT12DATA?
Abbreviations Used
IDN
IDY
IEC
IFC
REN
Manual Conventions RAM
RQC
RQS
Glossary of Symbols Used
List of Tables
4MANUAL Conventions
List of Figures
Documents Referenced
Scpi Conformance Information
TRIGgerSEQuence1 STARtVIDeoFORMatTYPE type command Purpose
Standards Information
Or abbreviation, e.g., type = Hdtv
List of Implemented IEEE-488.2 Syntactical Elements
Standards Information Program Message Unit Separator
Command Program Header
Program Data Separator
Program Header Separator
Channel 1/2/3/4 settings
End node settings
Probe scale settings
Common vertical settings
Event trigger delay settings
Delayed timebase settings
Cursor settings
Cursor autosearch settings
Display settings
MATH1/2 settings
Trace intensity settings
Display trace position settings
Index
Numerics
Index
Index
Index
Index
Index
Index
Index
Index
Index
Index
Index