Brief description of the SM2 monitoring system
Preface
Target group
Summary of contents
Volume 2 Analysis and Display of SM2 Monitored Data
Summary of contents
Changes made since the last version Preface
Changes made since the last version of the manual
SM2
Changes made since the last version
SET/MODIFY-COSMOS-PARAMETER
SET-SERVICETIME-PARAMETER
SET-TASK-PARAMETER
SHOW-ACTIVE/DEFINED-PARAMETER
Notational conventions
Notational conventions
SM2U1
SM2R1
Readme file Preface
Readme file
Overview
SM2 monitoring program
SM2
Overview SM2 monitoring program
Operating modes/users
SM2 operating modes
Operating modes/users SM2 monitoring program
Users
Privileged users
Nonprivileged users
Authorization table
Table of authorizations
Activating the monitoring task
Activating a monitoring task
USER-ADMISSION
Acquisition of monitored data
Acquisition of monitored data
Acquisition of monitored data SM2 monitoring program
BS2000
Monitoring cycle
Monitoring cycle
Online monitoring cycle
SM2 Measurement Status
Outputting and saving monitored data SM2 monitoring program
Outputting and saving monitored data
Outputting and saving monitored data
Uninterruptible clock resetting
Methods used for compressed output of monitored data
SM2 monitored variables SM2 monitoring program
SM2 monitored variables
Monitored variable Description
IOs
SM2 monitored variables
Memory
VM2000
Analyzing monitored data SM2 monitoring program
Analyzing monitored data
Performance expectations of the user
Interactive mode criteria
Performance expectations of the user
Batch processing criteria
Performance expectations of the user SM2 monitoring program
System monitoring
Using SM2 for system monitoring
Trend monitoring
System monitoring SM2 monitoring program Bottleneck analysis
Efficient DP system usage
Basic procedure for ensuring efficient DP system usage
14 SM2 in computer networks
Prerequisites for using SM2 in computer networks
SM2 in computer networks SM2 monitoring program
Selecting hosts with SM2
Users in a computer network
SM2 in computer networks
Screen output
Standard SM2 output file
Dynamic IO reconfiguration
SM2 monitoring programs
Overview SM2 monitoring programs
Monitored data on connection sets
Privileged SM2 monitoring programs
BCAM-CONNECTION
Remote
Local
Both
Examples of monitoring program definitions
Monitored data on the catalog management system
Monitored data on the channel load
CHANNEL-IO
Monitored data on the system for bottleneck analysis
Monitored data on disk access
Monitored data on DAB activities
Cosmos
Monitored data on lock requests
Monitored data on file access for selected disks
DISK-FILE
Monitored data on access to global storage
Monitored data on file access for selected files
Monitored data on volumes in global storage
Monitored data on file migration
Monitored data on communication between hosts
Monitored data on Isam pools
Monitored data on network devices
Monitored data on Hiplex Mscf
Monitored data on tasks
Monitored data on 3419/21 disk controllers under PCA
PCA
Monitored data on Posix
Monitored data on caches under User PFA
PFA
Responsetime
Monitored data on the Bcam pool
Example Calculating the time values
Example Responses to a /SHOW-FILE-ATTRIBUTES command
Connection-specific parameters
Examples of the Responsetime monitoring program
Servicetime
Monitored data on the service time
Global system and category-specific monitored data
Monitored data on SVC calls
SVC
Monitored data on TCP/IP connections
Task-specific monitored data
Task
Monitored data on UTM applications
Monitored data on locks
TLM
MODIFY-ACCOUNTING-PARAMETERS SET-RECORD-TYPE=UTMA
CPU shares of virtual machines
Nonprivileged SM2 monitoring programs
Monitored data on file access
Task
Starting the program
Starting and terminating SM2
Format
Operands
Monjv =
Terminating the program
Monjv = *NONE
CPU-LIMIT =
Overview of SM2 operation
Typical SM2 run SM2 operation
START-SM2 CALL-ADMINISTRATION-PART
Statements for SM2 adminstrators
Statements for SM2 administrators
Statements for defining monitoring programs
ADD-BCAM-CONNECTION-SET
INITIATE-COSMOS
Statements for outputting information
Statement for terminating the SM2 program
ADD-BCAM-CONNECTION-SET
Statements for SM2 administrators
Add connection set for BCAM-CONNECTION monitoring
Function
CONNECTION-SELECTION = *BY-NEA-NAME
CONNECTION-SELECTION =
CONNECTION-SELECTION = *BY-PORT-NUMBER
CONNECTION-TYPE =
HOST-SELECTION = *ANY
HOST-SELECTION =
HOST-SELECTION = *SPECIFIED
Add connection set for Responsetime monitoring
ADD-CONNECTION-SET
ADD-CONNECTION-SET
SET-DEFINITION = *BY-CONNECTION
SET-DEFINITION =
SET-DEFINITION = *EXCEPT-CONNECTION
CONNECTION-SET = list-poss5 *CONNECTION
CONNECTION-TYPE =
Define events for monitored-data acquisition
ADD-COSMOS-EVENT
ADD-COSMOS-EVENT
EVENT-NAME =
Define file to be monitored
ADD-FILE
ADD-FILE
FILE-NAME = filename
Define Isam pool to be monitored
ADD-ISAM-POOL
ADD-ISAM-POOL
Scope =
USER-ID = alphanum-name
Scope = *USER
CAT-ID =
CAT-ID = *HOME-PVS
Switch from evaluation part to administration facility
CALL-ADMINISTRATION-PART
CALL-ADMINISTRATION-PART
CALL-ADMINISTRATION-PART
CALL-EVALUATION-PART
Switch from administration facility to evaluation part
CALL-EVALUATION-PART
CALL-EVALUATION-PART
CHANGE-MEASUREMENT-PROGRAM
Type = *ISAM
Type = *SERVICETIME
Type = *PERIODIC-TASK
Type = *RESPONSETIME
Close SM2 output file
CLOSE-LOG-FILE
CLOSE-LOG-FILE
CLOSE-LOG-FILE
Terminate SM2 run
END
END
END
Prepare Cosmos monitoring program
INITIATE-COSMOS
INITIATE-COSMOS
INITIATE-COSMOS
Admit additional SM2 administrators
MODIFY-ADMINISTRATOR-ADMISSION
Modify parameters for Cosmos monitoring
MODIFY-COSMOS-PARAMETER
MODIFY-COSMOS-PARAMETER
MODIFY-COSMOS-PARAMETER
Title = *UNCHANGED
Title =
Title = c-string
BUFFER-SIZE =
BUFFER-SIZE = *UNCHANGED
ADDITIONAL-INFO = *CONFIGURATION
NUMBER-OF-BUFFERS =
NUMBER-OF-BUFFERS = *UNCHANGED
Output = *TAPE
Output = *WRAP-AROUND
Output = *STREAM-TAPE
TASK-SELECTION =
Category = *NOT-SPECIFIED
Category =
USER-ID =
USER-ID = *NOT-SPECIFIED
EVENT-SELECTION = *UNCHANGED
EVENT-SELECTION =
EVENT-SELECTION = *ALL-BY-ADD-COSMOS-EVENT
EVENT-SELECTION = *SPECIFIED
DAB-CACHE-ID = *UNCHANGED
DAB-CACHE-ID =
DAB-CACHE-ID = *ANY
MEMORY-CLASS =
TSKI-SWITCH = *UNCHANGED
TSKI-SWITCH =
TSKI-SWITCH = *ANY
TSKI-SWITCH = *TASK
Unload = *AT-SM2-STOP
Unload = *AT-MEASUREMENT-PROGRAM-STOP
MEASUREMENT-TIME =
MEASUREMENT-TIME = *UNCHANGED
Modify SM2 monitoring cycle
MODIFY-MEASUREMENT-PERIODS
ONLINE-PERIOD = integer
ONLINE-PERIOD = *SAME-AS-OFFLINE
SAMPLING-PERIOD =
SAMPLING-PERIOD = *UNCHANGED
Modify parameters for Responsetime monitoring
MODIFY-RESPONSETIME-PARAMETER
Definition = *UNCHANGED
Definition =
Definition = *1
Definition = *2
TRANSACTTIME-BUCKETS = *UNCHANGED
TRANSACTTIME-BUCKETS =
TRANSACTTIME-BUCKETS = *STD-LIMITS
WAITTIME-BUCKETS =
MODIFY-USER-ADMISSION
Define authorizations for nonprivileged users
MODIFY-USER-ADMISSION
Task =
Task = *INHIBIT
USER-ID = *ALL
File =
File = *UNCHANGED
Isam = *INHIBIT
Isam = *ALLOW
Open SM2 output file
OPEN-LOG-FILE
OPEN-LOG-FILE
File = *STD
BUFFER-OUTPUT = *NORMAL
BUFFER-OUTPUT =
BUFFER-OUTPUT = *IMMEDIATE
Exclude connection sets from BCAM-CONNECTION monitoring
REMOVE-BCAM-CONNECTION-SET
REMOVE-BCAM-CONNECTION-SET
SET-NAME =
REMOVE-CONNECTION-SET
REMOVE-CONNECTION-SET
SET-NAME = SET-NAME = *ALL
REMOVE-CONNECTION-SET
Remove events from Cosmos monitoring parameters
REMOVE-COSMOS-EVENT
REMOVE-COSMOS-EVENT
EVENT-NAME = *ALL
REMOVE-COSMOS-EVENT
Remove files from File monitoring parameters
REMOVE-FILE
REMOVE-FILE
FILE-NAME = FILE-NAME = *ALL
Remove Isam pools from Isam monitoring parameters
REMOVE-ISAM-POOL
REMOVE-ISAM-POOL
POOL-NAME = POOL-NAME = *ALL
CAT-ID = *ANY
Define hosts for SM2 statements and screen output
SELECT-HOSTS
111
Define BCAM-CONNECTION monitoring parameters
SET-BCAM-CONNECTION-PARAMETER
INPROC-BUCKETS = *STD-LIMITS
INPROC-BUCKETS =
INPROC-BUCKETS = *UNCHANGED
OUTPROC-BUCKETS =
Define CHANNEL-IO monitoring parameters
SET-CHANNEL-IO-PARAMETER
SET-CHANNEL-IO-PARAMETER
Channels = Channels = *ALL
Define Cosmos monitoring parameters
SET-COSMOS-PARAMETER
SET-COSMOS-PARAMETER
SET-COSMOS-PARAMETER
116
Title = C’COSMOS’
Tasks are selected by means of their job name
Tasks are selected by means of their category
EVENT-SELECTION = *ALL-BY-ADD-COSMOS-EVENT
121
Unload =
Define Disk monitoring parameters
SET-DISK-PARAMETER
SET-DISK-PARAMETER
Devices = list-poss256 alphanum-name 2..4 with-wild
Define DISK-FILE monitoring parameters
SET-DISK-FILE-PARAMETER
SET-DISK-FILE-PARAMETER
Devices = list-poss8 alphanum-name
Define PERIODIC-TASK monitoring parameters
SET-PERIODIC-TASK-PARAMETER
JOB-NAME = list-poss64 alphanum-name
Define Responsetime monitoring parameters
SET-RESPONSETIME-PARAMETER
SET-RESPONSETIME-PARAMETER
SET-RESPONSETIME-PARAMETER
RESPONSETIME-BUCKETS = *STD-LIMITS
CONNECTION-NUMBER = *1024
RESPONSETIME-BUCKETS = list-poss5 integer
WAITTIME-BUCKETS = *STD-LIMITS
Define Servicetime monitoring parameters
SET-SERVICETIME-PARAMETER
SET-SERVICETIME-PARAMETER
SET-SERVICETIME-PARAMETER
Define Sysstat monitoring parameters
SET-SYSSTAT-PARAMETER
SET-SYSSTAT-PARAMETER
USED-DEVICES = USED-DEVICES = *NONE
Define Task monitoring parameters
SET-TASK-PARAMETER
SET-TASK-PARAMETER
SET-TASK-PARAMETER
USER-ID = USER-ID = *NOT-SPECIFIED
TSN = TSN = *NOT-SPECIFIED
JOB-NAME = JOB-NAME = *NOT-SPECIFIED
JOB-CLASS = JOB-CLASS = *NOT-SPECIFIED
Devices = *NONE
Devices =
Devices = *ALL
Output active monitoring parameters
SHOW-ACTIVE-PARAMETER
SHOW-ACTIVE-PARAMETER
Type = *ALL
Type = *ISAM
Output defined monitoring parameters
SHOW-DEFINED-PARAMETER
SHOW-DEFINED-PARAMETER
SHOW-DEFINED-PARAMETER
Type = *DISK-FILE
Output monitoring status
SHOW-MEASUREMENT-STATUS
SHOW-MEASUREMENT-STATUS
SHOW-MEASUREMENT-STATUS
Output selected hosts
SHOW-SELECTED-HOSTS
SHOW-SELECTED-HOSTS
SHOW-SELECTED-HOSTS
Output status of SM2 system tasks
SHOW-SM2-STATUS
From = *ACTUAL
From =
From = integer
Output monitored objects and associated users
SHOW-USER-MEASURED-OBJECTS
SHOW-USER-MEASURED-OBJECTS
SHOW-USER-MEASURED-OBJECTS
Start monitoring program run
START-MEASUREMENT-PROGRAM
Type = *GS
Type = *DLM
Type = *GSVOL
Type = *HSMS
Type = *TLM
Type = *TCP-IP
Type = *UTM
Type = *VM
Terminate monitoring program run
STOP-MEASUREMENT-PROGRAM
STOP-MEASUREMENT-PROGRAM
STOP-MEASUREMENT-PROGRAM
Terminates the DISK-FILE monitoring program
Terminates the Sysstat monitoring program
Statements for nonprivileged users
Default values for statements
Statements for nonprivileged users SM2 operation
Statements for selecting monitored data for screen output
Statements for controlling reports
Statements for nonprivileged users
Statements for nonprivileged users SM2 operation
Input during monitoring
Starting report output
154
155
General statements
Break
Switch to system mode
Break
Include and exclude Isam pools
CHANGE-ISAM-STATISTICS
CHANGE-ISAM-STATISTICS
ADD-POOL
Scope
=*NONE
= *HOST-SYSTEM
=*USER
Select devices with monitored data
Device
Device
Disk ALL
Monitoring cycle
Terminate monitoring
Monitor files
File
Name
Stats
Request user help information
Help
Help
Output
Define output mode
Output
=CONTROLLED
Interval
Insert remarks
Remark
Remark
Select reports
Report
Report
STD
170
With SR2000, the GS and Gsvol reports are not available
Start output of selected reports
Restart
Restart
Select DAB cache
SELECT-DAB-CACHE
SELECT-DAB-CACHE
ADD-CACHE-ID
Select cache for PCA Device report
SELECT-PCA-CACHE
SELECT-PCA-CACHE
Cache
CACHE-ID=*ALL
Select controllers for PCA Cache report
SELECT-PCA-CONTROLLER
SELECT-PCA-CONTROLLER
Controller
SELECT-PERIODIC-TASK-PARAMETER
SELECT-PERIODIC-TASK-PARAMETER
OUTPUT-INFORMATION
Sort
=SERVICE-UNITS, CPU, IO, UPG, PAGING-READ
Select PFA cache
SELECT-PFA-CACHE
SELECT-PFA-CACHE
Select Symmetrix controllers
SELECT-SYMMETRIX-CONTROLLER
SELECT-SYMMETRIX-CONTROLLER
ADD-CONTROLLER-MN
REMOVE-CONTROLLER-MN
Select UTM applications
SELECT-UTM-APPLICATION
SELECT-UTM-APPLICATION
ADD-APPLICATION
Type =TASK
Output monitored objects
Start report output
Start
Start
Monitor Isam pools
START-ISAM-STATISTICS
START-ISAM-STATISTICS
POOL-NAME
Pool
TSN=
Status
Status
Terminate monitoring of Isam pools
STOP-ISAM-STATISTICS
STOP-ISAM-STATISTICS
Activating user task monitoring
BS2000 commands for activating user task monitoring
Activating user task monitoring SM2 operation
Formats
TSN = *OWN
START-TASK-MEASUREMENT
PCOUNTER-INTERVAL = *NONE
PCOUNTER-INTERVAL =
SVC-STATISTICS =
SVC-STATISTICS = *OFF
SC2 SC1 Maincode Meaning/guaranteed messages
Command return codes
File =*STD File =*BY-LINK-NAME
Attributes of the user-specific SM2 output file
Activating user task monitoring SM2 operation
SM2 output file
Writing to the SM2 output file
Introduction
Attributes of the SM2 output file
BLOCK-CONTROL-INFO= *WITHIN-DATA-BLOCK
SM2 output file SM2 operation
Managing the SM2 output file PAM output file
Opening and closing the SM2 output file
SM2 output file SM2 operation SAM output file
Examples
SM2 monitoring program examples
Examples SM2 operation
SM2 screen output
SM2 reports SM2 screen output
SM2 reports
Overview of the utilization of Symmetrix controllers for
Measurement Status
SM2 information screens
Displaying follow-up screens to information screens
Cycle
SM2 information screens SM2 screen output
Samples
Representation of values in SM2 output screens
Report name Identifiers
Output sequence
Output sequence
ACF report
SM2 reports ACF report
Report output
Monitoring information
Resource Utilization in Last Interval
Activity report
Activity report
TPR
CPU Utilization
SIH
Idle
Sract
PCS Data
Rdact
IO’S PER SEC
Tasks Current Task Type
Activity report SM2 reports
SYS
#-TASKS
#-ACT
Tasks in Scheduler Queues
CPU-Q
IO-Q
NPP
Memory
WS-ACT
WS-WACT
Response Statistics
Posix Data
Bcam Connection report SM2 reports
Bcam Connection report
Bcam Connection report
Category report SM2 reports
Category report
Category Name
Category report
CPU-TIME %
PAGING-IO 1/S
Category Queue report
MIN MPL MAX MPL Weight
Category Queue report SM2 reports
Task category
Category Queue report
ACT
Task in Scheduler Queues
Wact
Nadm
Category Wset report
Category WSET-Report
WS-ALL PPC
UPG
WS-WACT PPC
WS-ACT PPC
Channel report
Channel report
Program TYPE=*CHANNEL
Channel report SM2 reports Monitoring information
CMS report
CMS report
Multiprocessor systems
CMS report SM2 reports
Pageable
#-BMT
Resident
SER. QU
REQ. QU
Block QU
Userid QU
Read
Items
READ-LBN
Scan
LOCAL-FILE /S
Responsetime MS
REMOTE-FILE /S
SHARED-FILE /S
CPU report
CPU report
Stop %
Measured
Normed
DAB reports
DAB reports
DAB report SM2 reports
DAB report
CACHE-ID
Size
Write 1/S
DAB report
DAB Cache report SM2 reports
DAB Cache report
MOD
DAB Cache report
MED
Sizefix
FIRST-HP,LAST-HP
VSN / File
243
Device report SM2 reports
Device report
Tape
Device report
Print
Other
Device
Volume
Type
Activity
Active
Utilization
Disk File report SM2 reports
Disk File report
Program TYPE=*DISK-FILE
Write
Disk File report
Filename
VSN
DLM report SM2 reports
DLM report
Number Enqueue 1/S
Number Convert 1/S
Number Information 1/S
DLM report
Number Grant Events 1/S
Number Release Events 1/S
File reports SM2 reports
File reports
Outputting monitored data in the File reports
Privileged File Report
Wait
File reports
Check
Time
Global report
Global report
GS report SM2 reports
GS report
Partition
Unit
Gsvol report
Gsvol report
DEVICE-MN
Isam reports SM2 reports
Isam reports
Outputting monitored data in the Isam reports
Isam reports
FXD PGS
Memory report
Memory report
SM2 Memory Report SYS
SM2 Memory Report SEL
ONLY-Q
Main Memory Frames
WR-Q
SYS-GLOB
Used
Paging Area Frames Total
# Pages in Virtual Memory CL1
CL2
Memory report SM2 reports
Faults Total
1ST-READ
Reclaims
Transfers GS Read
Transfers Read
Mscf report SM2 reports
Mscf report
Calls
Shortages
Mscf report
AVG Wait
Request with Reply AVG Time
# Requests
Flow State AVG Time
NET Device report
NET Device report
Device Type
#BYTES 1/IO
NSM report SM2 reports
NSM report
NSM report
PCA reports SM2 reports
PCA reports
PCA reports
PCA Cache report SM2 reports
PCA Cache report
PCA Cache report
PCA Controller report SM2 reports
PCA Controller report
CTL DEV
#CACH
PCA Controller report
PCA Device report SM2 reports
PCA Device report
Device MN
Device VSN
Read H-RATE %
PCA Device report
PCS report SM2 reports
PCS report
Sract 1/SEC
CPU
Sqpln %
PCS report
SQACT%
DUR-RO 1/SEC
Program TYPE=*PERIODIC-TASK
Periodic Task report SM2 reports
TU+TPR
Periodic Task report
Userid
TSN
JOB-NAME
TYP
PFA reports
PFA reports
PFA Cache report SM2 reports
PFA Cache report
Cache ID
Cache MED
BLK Size
PFA Cache report
RD HIT
WR HIT
PFA Controller report SM2 reports
PFA Controller report
Controller Type 3419 3421 3860 Symmetrix
CTL MN
PFA Controller report
#DEV
SEC NR
Posix report SM2 reports
Posix report
Rcache
Posix report
Wcache
SREAD/S, SWRITE/S, FORK/S, EXEC/S
Responsetime report SM2 reports
Responsetime report
Program TYPE=*RESPONSETIME
Responsetime report
D016ZE04 SM2 Responsetime Category Cycle
RESP. Time
CONN-TYPE
Think Time
TRANS. Time
Rate 1/SEC
NR. Inter
INPUT-LEN
OUTPUT-LEN
Responsetime
Catgory Name
AVG
Rate
#INT
Shared PVS report
Shared PVS report
Shared PVS report SM2 reports Monitoring information
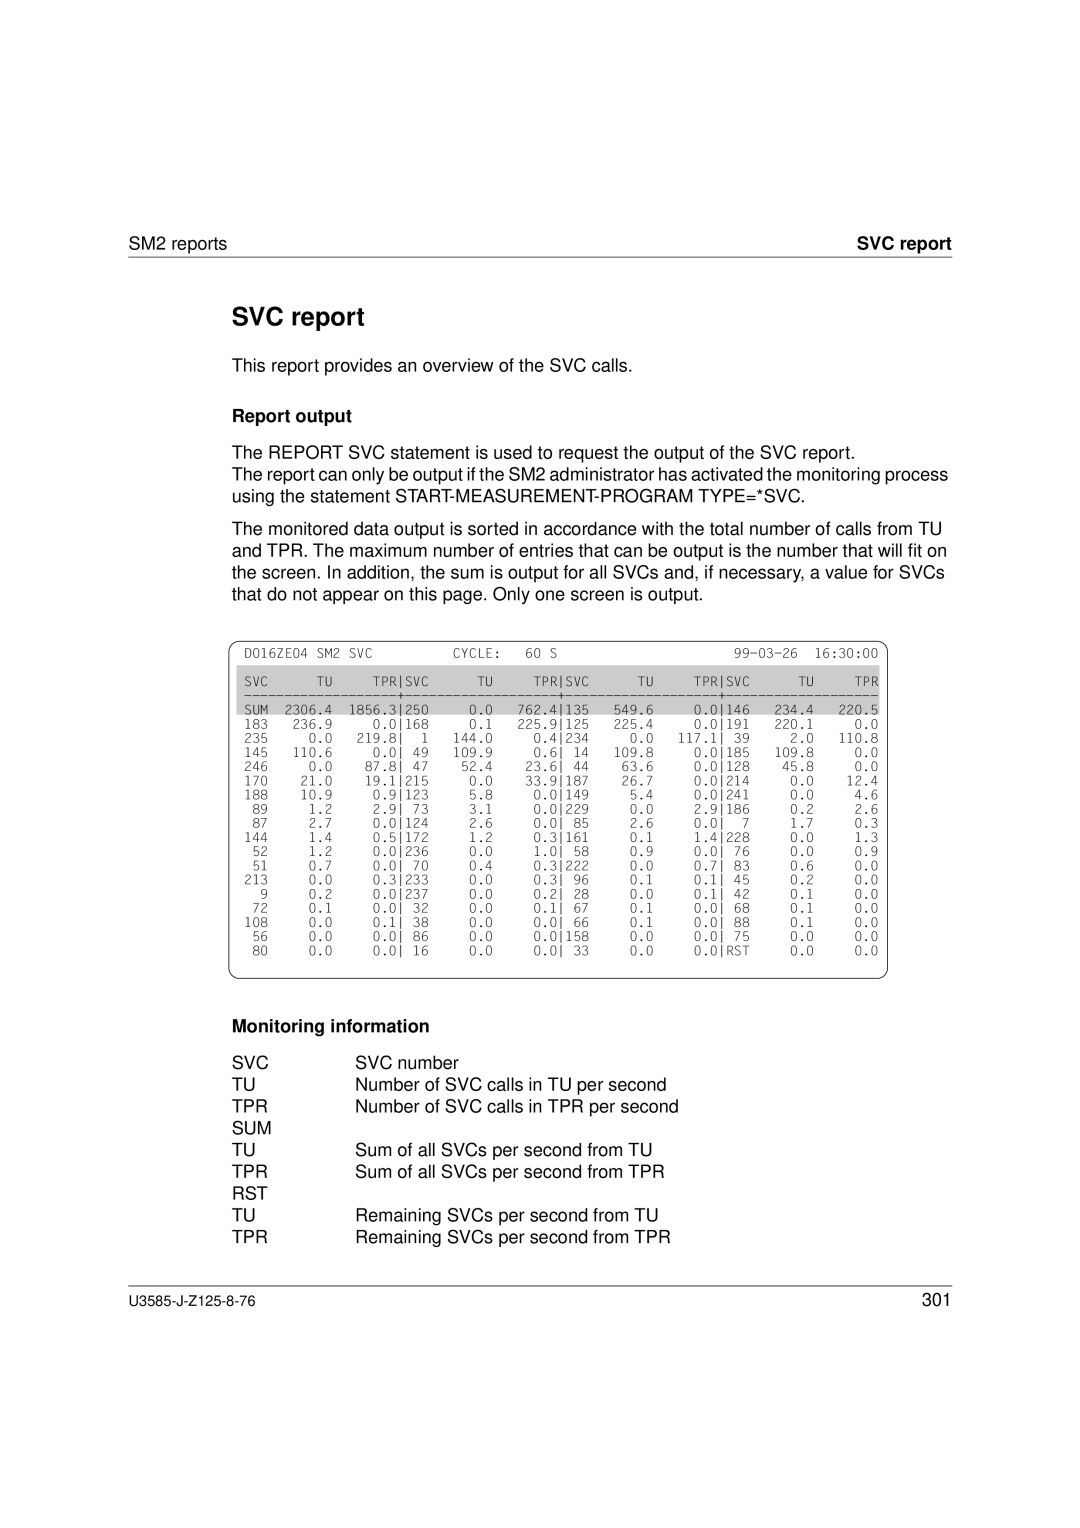
SVC report
SVC report
SVC
SUM
Symmetrix reports SM2 reports
Symmetrix reports
Symmetrix Controller report
Symmetrix Controller report
Controller MN
TOT HIT
Symmetrix Device report
Symmetrix Device report
Mnemonic name of the device
TCP/IP report
TCP/IP report
TCP/IP report SM2 reports Monitoring information
TLM report
TLM report
Waiting Task
Occupations
UTM reports SM2 reports
UTM reports
UTM report
UTM Report
APPLI-NAME
TAC-CL DDP # DS #DB-CALL # TSK # User
UTM report SM2 reports
UTM Application report
UTM Application report
TOT Time with DB
Total Time
Steps with DB
Time in DB
# Dial TA’S
# Dial Steps
Asyn TA’S
Asyn Conv
VM2000 report SM2 reports
VM2000 report
VM2000 report
Number of CPU’S
CPU Meas
Active Parameter
SM2 information screens
Active Parameter
SET-NAME
BCAM-CONNECTION-SET
Connection
CHANNEL-IO Parameter Channels
ADDITIONAL-INFO
NUMBER-OF-BUFFERS
Output
TASK-SELECTION
IO-DEVICE
EIA-SVC-NUMBER
DAB-CACHE-ID
MEMORY-CLASS
File Parameter Filename
DISK-FILE Parameter Devices
PERIODIC-TASK Parameter
Isam Parameter POOL-NAME
LOG Tasks
USER-ID JOB-NAME Responsetime Parameter Scope
CONNECTION-SET SET-NAME
Servicetime Parameter
SET-DEFINITION
Partner
Task Parameter Task Selection
Sysstat Parameter Devices
Defined Parameter
Defined Parameter
TSN of SM2 Primary Administrator
General administration data
Measurement Status
Measurement Status
Either
Status data on additional functions
Secondary Administrator Allowed
User Measurements Allowed
Privileged Measurements Defined
CHA-IO
Bcam
CMS
COSM+
Selected Hosts
Selected Hosts
Information on the selected hosts
Status Table
Status Table
Task / SS
Start Time
Ended
Running
Abended
USE
Create
Reason
Term
Modul
User Measured Objects
User Measured Objects
By Task
Isam Parameter Pool
Measured USER-ID
Task Parameter Measured TSN
Measuring TSN
Measuring USER-ID
Page
External storage utilization
System resource utilization by SM2
System resource utilization
CPU utilization
Method based on monitoring cycle
Method based on samples
Write task and I/O buffer
UTM monitoring program
System resource utilization User task statistics
Main memory utilization
Accuracy of the SM2 data
Inaccuracies resulting from marginal problems
Causes of inaccuracies
Accuracy of the SM2 data
Accuracy of the SM2 data Monitoring method inaccuracies
Device utilization
CPU utilization
Channel utilization
Measures for reducing the error sources
1 SM2 together with VM2000
Special applications
Special applications VM2000
VM2000 operation on /390 architecture
349
VM2000 operation on Risc architecture VM2000/SR
Servicetime monitoring values with Symmetrix control
Volume load with installed DRV
Channel load with BUS peripherals
Sample procedures
Sample procedures
353
354
355
356
357
358
359
360
Table of monitored variables
Variables reports
Reports on monitored variables
Monitored variables
363
Page
Response
Meaning
START-MEASUREMENT-PROGRAM Cosmos
NPC0055 Messages
NPC0061
LINK=COSFIL
NPC0068 Messages
WRAP-AROUND
NPC0074
NPS0002 Messages
NPS0015
NPS0025 Messages
NPS0033
Class
NPS0040
NPS0048
SW-MONITOR-ADMINISTRATION
NPS0053 Messages
NPS0065
NPS0502 Messages
NPS0515
BUFFER-LENGTH
NPS0521 Messages
Check and correct monitoring program definition
NPS0528
NPS0533 Messages
NPS0540
NPS0545 Messages
NPS0551
NPS0559 Messages
NPS0564
NPS0569 Messages
NPS0577
Macro returns &00
NPS0600 Messages
NPS3004
NPS3013 Messages
OPEN-MODE=EXTEND
NPS3021
NPS4139 Messages
NPS4310
NPS4317
NPS4354
NPS4553 Messages
NPS4652
NPS4801
SM2U1
SM2
SM2R1 SYSLNK.SM2.130
SRMLNK.SM2.130
Installation
Installation procedure
Activating the syntax file
MODIFY-MSG-FILE-ASSIGNMENT
Writing to the Dssm configuration file
Creating a new Dssm catalog
Loading and unloading the subsystem
Metasyntax
SDF syntax description
Data types
SDF syntax description Appendix Suffixes for data types
Metasyntax Representation Meaning Examples
SDF syntax description
GUIDANCE-MODE = *NO / *YES
Representation Meaning Examples
Data types Character set Special rules
Data type Character set Special rules
411
412
Product-version Input format Vnn.nann Period Single quote
414
Suffixes for data types Meaning
Suffixes for data types
Suffix Meaning
417
418
419
AB2
AB1
AAD
D.XYA ABD D.XYB BAF F.XYA BBF F.XYB
421
ISP syntax description Appendix
ISP syntax description
Format description
Length of the statements
ISP syntax description
Overview of SM2 statements
Overview of statements for the SM2 administrator
SM2 statements overview Appendix
SM2 statements overview
426
427
428
429
430
431
432
433
434
435
436
Overview of statements for the nonprivileged user
Switch to system mode
AppendixSM2 statements overview
Activate and deactivate Isam pools
Terminate monitoring
Define output mode
Monitor files
Call user help functions
Start output of selected reports
Select reports
Select DAB cache area
Select cache area for PCA Device report
Select PFA cache area
Select controllers for PCA Cache report
Select UTM applications
Select Symmetrix controllers
Output monitored objects
Start report output
Determine monitoring status
Monitor Isam pools
Deactivate all activated Isam pools
Activation
Mode
Activation decision
Caching
Background storage
Counting of I/O operations and their duration
Glossary Channels
Glossary
CPU time and CPU service units on SR2000
Deactivation, forced deactivation
DMS I/O operations
Glossary Dilation factor
Dwell time
Excp
firmware service time DCS
Expanded storage ES
Hardware service time non-DCS
Hardware service time DCS
Glossary Global storage GS
Hiperfile concept
Main memory
Glossary Interaction
Overall performance
Glossary Fault
Glossary Paging in BS2000
Paging memory
Paging I/O operations
Paging rate
Path info
Glossary Processor states
Risc mode
Response time
Glossary SDV Start Device
Service times definition DCS, I/O operations
Software service time non-DCS
Software service time DCS
Task queues
Time equivalent for the housekeeping performance
Transaction
Glossary Time equivalent for the productive performance
Glossary Virtual address space subdivision
Page
List of Figures
Page
List of Tables
Page
BS2000/OSD-BC V3.0 DMS Macros
Related publications
BS2000/OSD-BC V3.0 Performance Handbook
Hiplex Mscf V2.0A BS2000/OSD Multiprocessor System
Related publications BS2000/OSD-BC
BS2000/OSD-BC System Installation User Guide
SM2-PA V2.0A BS2000/OSD SM2 Program Analyzer User Guide
Virtual Machine System User Guide
Related publications
Generating and Handling Applications User Guide
Concepts and Functions User Guide
13 BS2000/OSD-BC V4.0 Commands, Volume 1, a C User Guide
15 BS2000/OSD-BC V4.0 Commands, Volume 3, MOD-J R User Guide
17 BS2000/OSD-BC V4.0 Commands, Volume 5, SH-P Z User Guide
Related publications 18 BS2000/OSD-BC
OSD-SVP SR2000 Operation and Administration User Guide
SDF-P-BASYS V2.1A
User Reference Manual
Srdf
SHC-OSD V2.0A BS2000/OSD Symmetrix Host Component User Guide
Spool
Related publications 23 BS2000/OSD
Index
Index
Disk controllers with cache
File
Hiplex Mscf
DCS
Nonprivileged monitoring program
MIN MPL
Index
483
PGE task
485
SENSE-SDV
487
Index
489
Index
Contents
Contents
CALL-EVALUATION-PART
MODIFY-ADMINISTRATOR-ADMISSION
CHANGE-MEASUREMENT-PROGRAM
CLOSE-LOG-FILE
SET-RESPONSETIME-PARAMETER
SET-PERIODIC-TASK-PARAMETER
SET-SYSSTAT-PARAMETER
SHOW-ACTIVE-PARAMETER
SM2 screen output 201
PCA Controller report 276
361
339
365
401
Page
Edition August
Software Monitor Volume 1 Administration and Operation
Fax 0 89 6 36-4 04