DSM250 User’s Manual
selected by setting a value for the XTE alarm (See Section 5.2.1, “Alert Setup Menu”, on page 27 for details).
Figure 241 – Rolling Road Display
7.7Line Graph
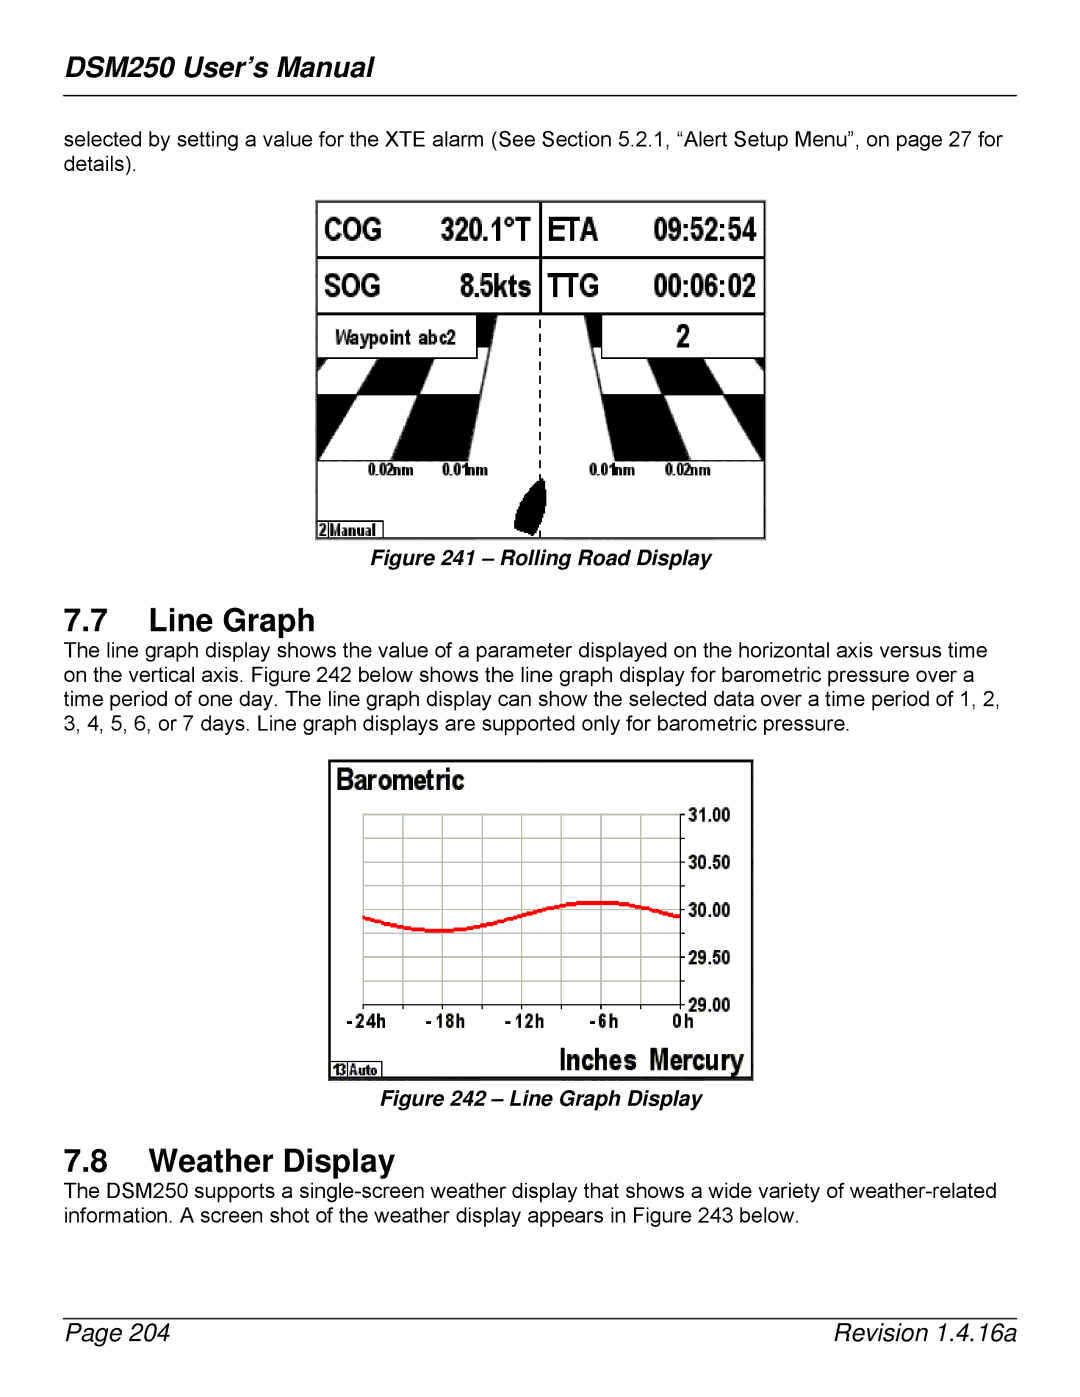
The line graph display shows the value of a parameter displayed on the horizontal axis versus time on the vertical axis. Figure 242 below shows the line graph display for barometric pressure over a time period of one day. The line graph display can show the selected data over a time period of 1, 2, 3, 4, 5, 6, or 7 days. Line graph displays are supported only for barometric pressure.
Figure 242 – Line Graph Display
7.8Weather Display
The DSM250 supports a
Page 204 | Revision 1.4.16a |