High availability | Managing the HA cluster |
|
|
Figure 16: Example cluster members list
Monitoring cluster members
To monitor health information for each cluster member.
1Connect to the cluster and log into the
2Go to System > Status > Monitor.
CPU, Memory Status, and Hard disk status is displayed for each cluster member. The primary unit is identified as Local and the other units in the cluster are listed by serial number.
The display includes bar graphs of current CPU and memory usage as well as line graphs of CPU and memory usage for the last minute.
For more information, see “Viewing CPU and memory status” on page 110.
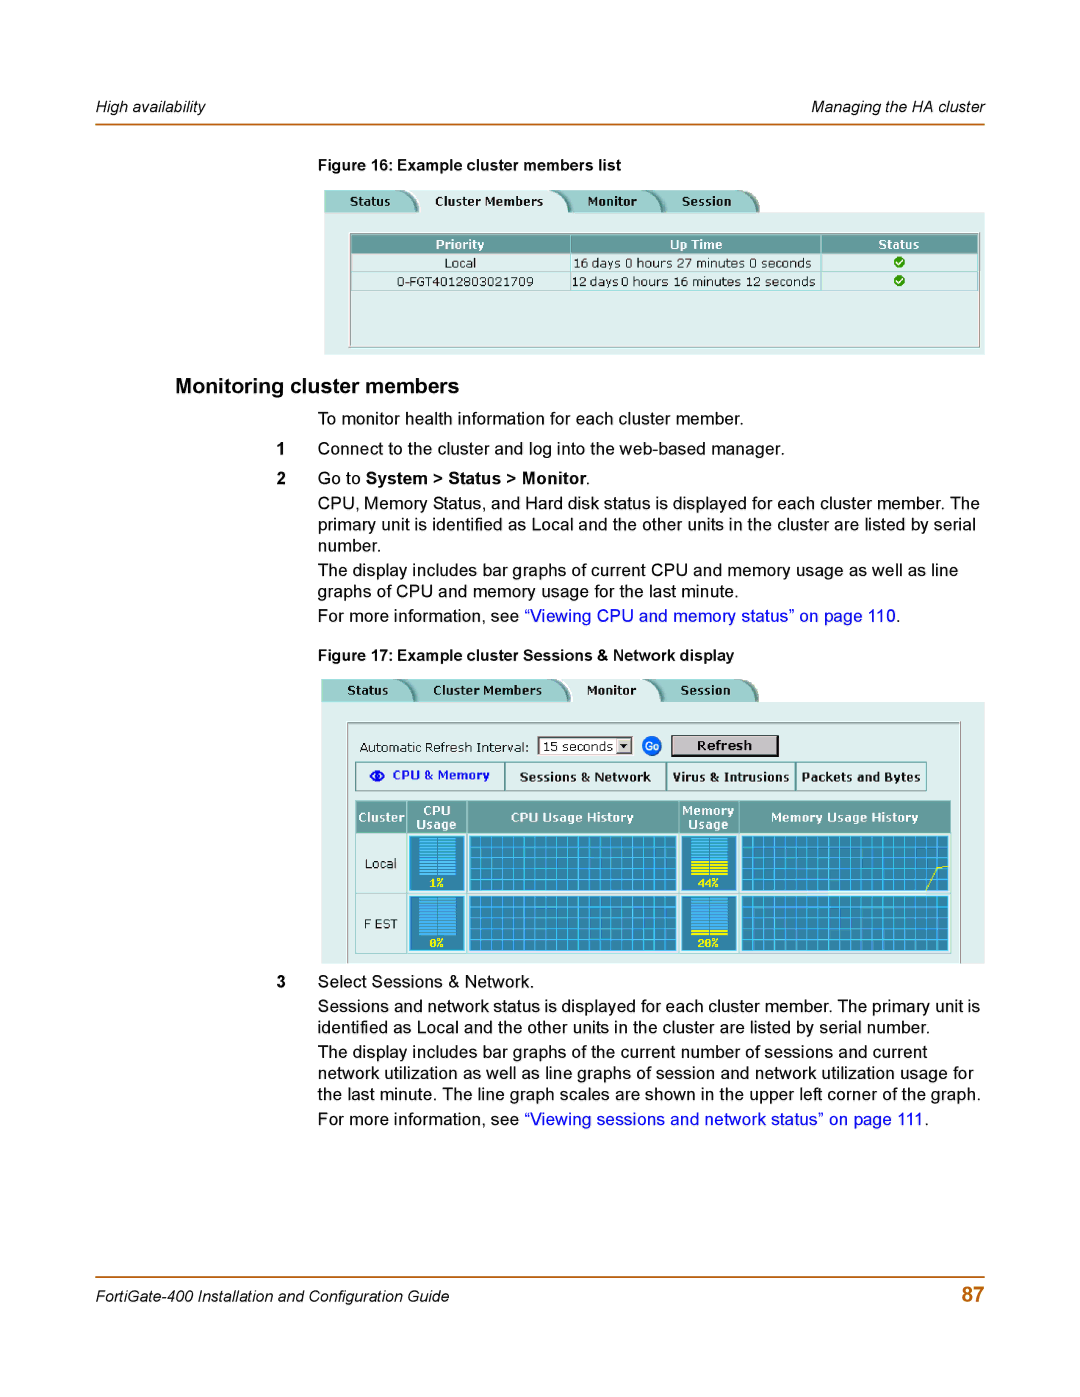
Figure 17: Example cluster Sessions & Network display
3Select Sessions & Network.
Sessions and network status is displayed for each cluster member. The primary unit is identified as Local and the other units in the cluster are listed by serial number.
The display includes bar graphs of the current number of sessions and current network utilization as well as line graphs of session and network utilization usage for the last minute. The line graph scales are shown in the upper left corner of the graph. For more information, see “Viewing sessions and network status” on page 111.
87 |