RealView Debugger Desktop
Figure 6-2 Title bar
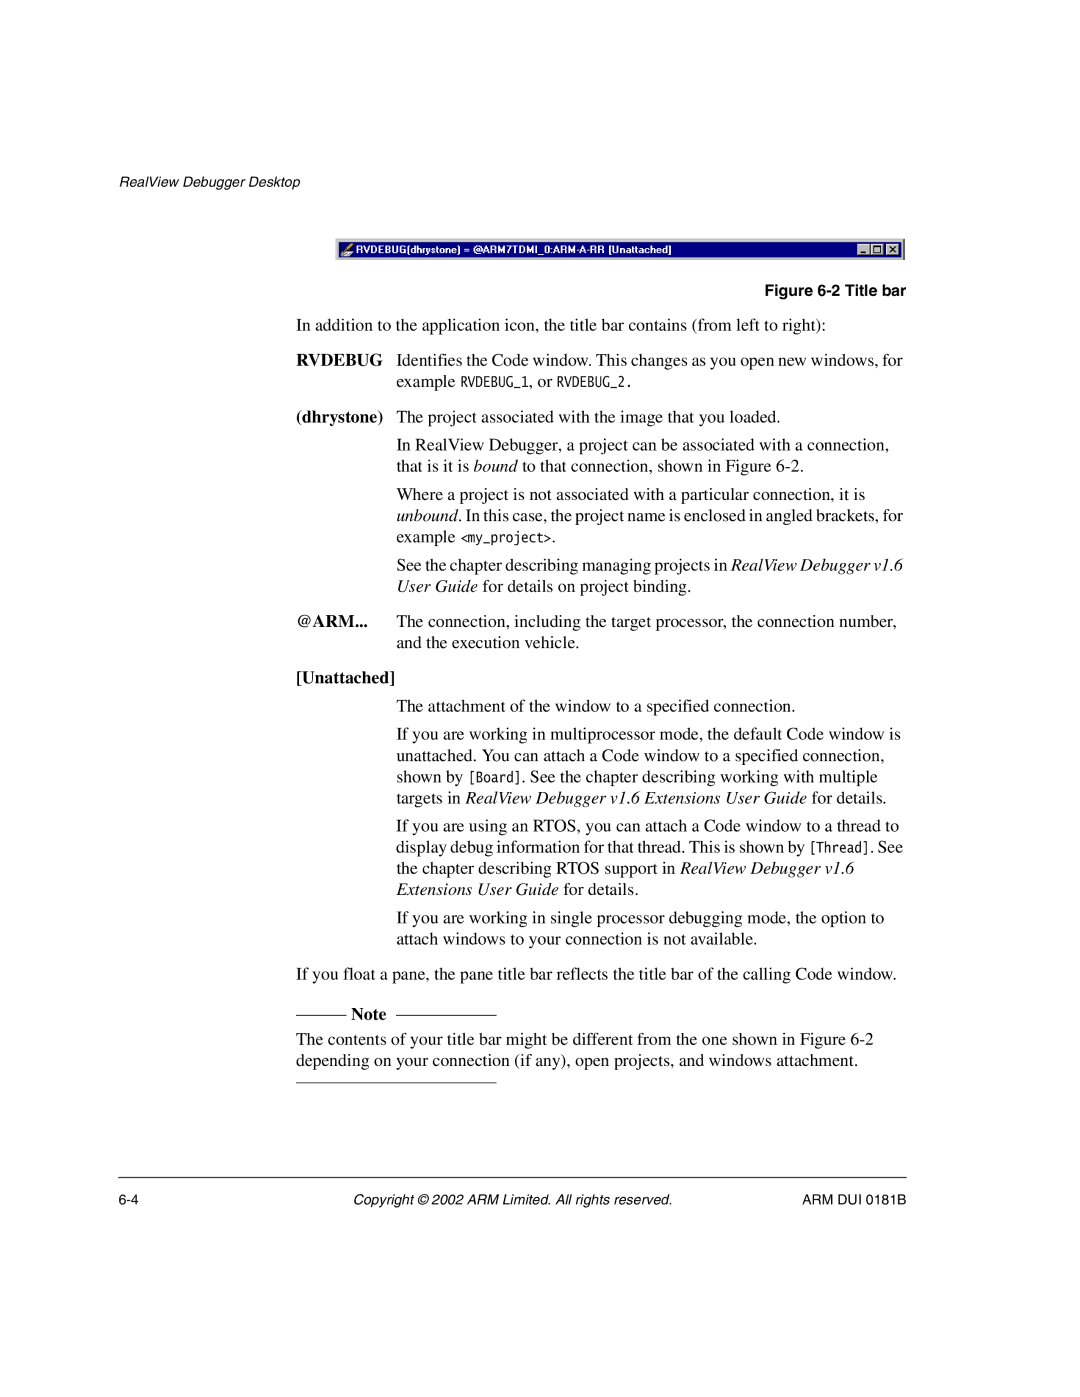
In addition to the application icon, the title bar contains (from left to right):
RVDEBUG Identifies the Code window. This changes as you open new windows, for example RVDEBUG_1, or RVDEBUG_2.
(dhrystone) The project associated with the image that you loaded.
In RealView Debugger, a project can be associated with a connection, that is it is bound to that connection, shown in Figure
Where a project is not associated with a particular connection, it is unbound. In this case, the project name is enclosed in angled brackets, for example <my_project>.
See the chapter describing managing projects in RealView Debugger v1.6
User Guide for details on project binding.
@ARM... The connection, including the target processor, the connection number, and the execution vehicle.
[Unattached]
The attachment of the window to a specified connection.
If you are working in multiprocessor mode, the default Code window is unattached. You can attach a Code window to a specified connection, shown by [Board]. See the chapter describing working with multiple targets in RealView Debugger v1.6 Extensions User Guide for details.
If you are using an RTOS, you can attach a Code window to a thread to display debug information for that thread. This is shown by [Thread]. See the chapter describing RTOS support in RealView Debugger v1.6 Extensions User Guide for details.
If you are working in single processor debugging mode, the option to attach windows to your connection is not available.
If you float a pane, the pane title bar reflects the title bar of the calling Code window.
Note
The contents of your title bar might be different from the one shown in Figure
Copyright © 2002 ARM Limited. All rights reserved. | ARM DUI 0181B |