9.Click OK to close the Set Address/Data Break/Tracepoint dialog box. The code view is updated and a yellow disc appears to show that a conditional breakpoint has been set. The Cmd tab, in the Output pane, shows the RealView Debugger command used to set the breakpoint.
10.Click the Go button on the toolbar to execute the image. When the breakpoint is reached, execution stops and RealView Debugger displays a message in the Cmd tab of the Output pane to identify the point in the source code where the program stopped.
11.Click Go again to complete execution.
If you try to set a breakpoint on a
Managing breakpoints
To display the current breakpoint details:
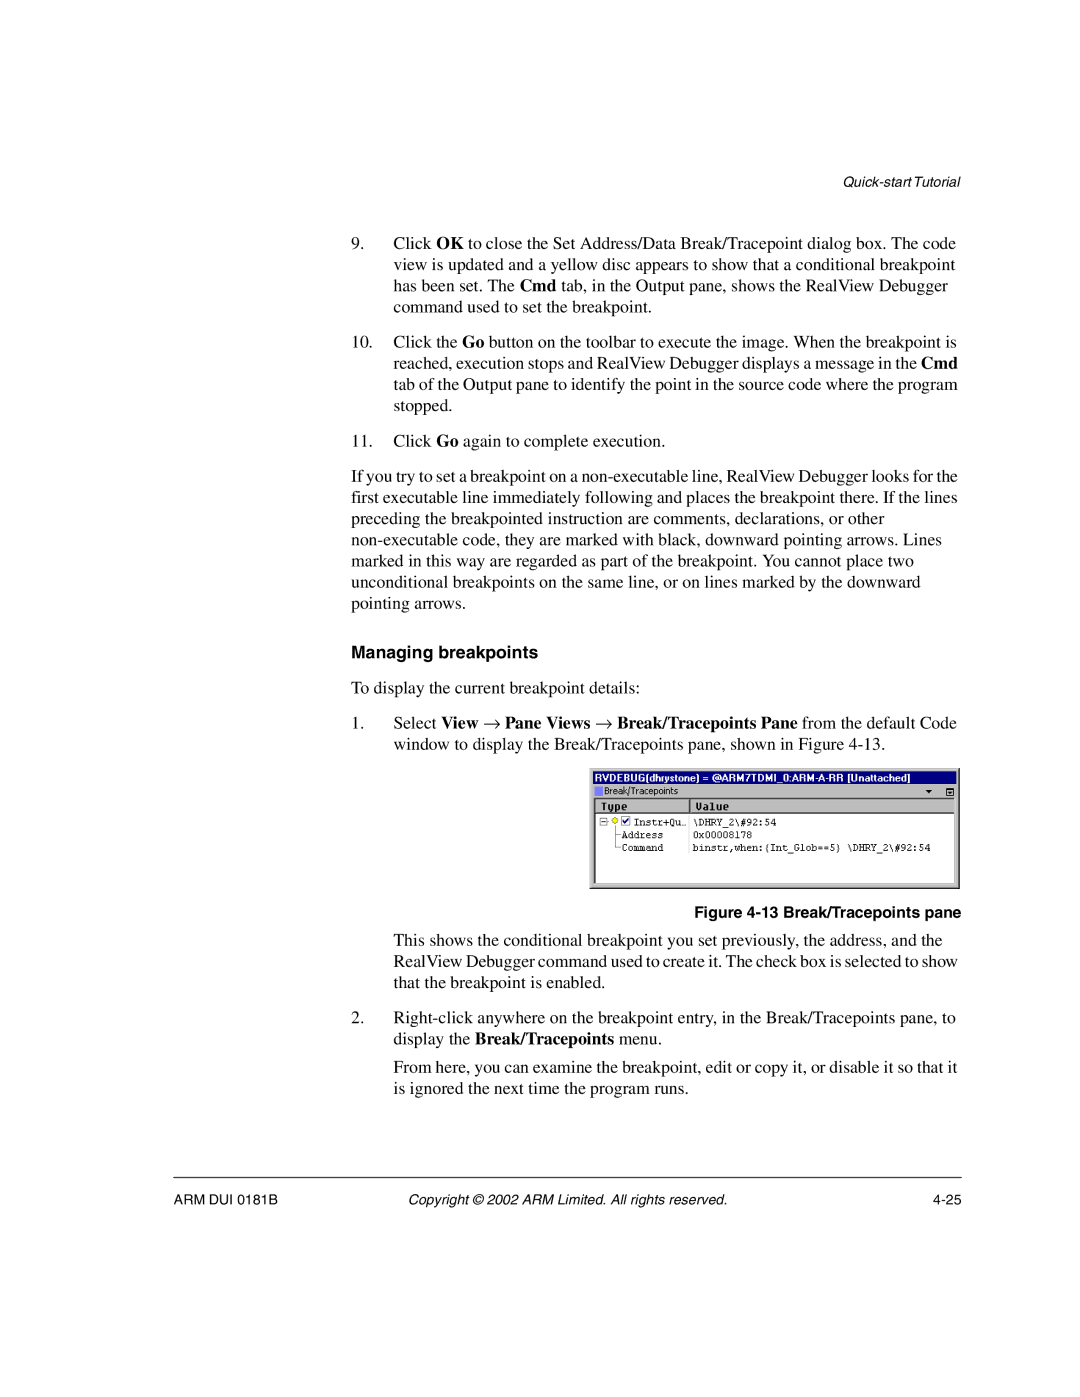
1.Select View → Pane Views → Break/Tracepoints Pane from the default Code window to display the Break/Tracepoints pane, shown in Figure
Figure 4-13 Break/Tracepoints pane
This shows the conditional breakpoint you set previously, the address, and the RealView Debugger command used to create it. The check box is selected to show that the breakpoint is enabled.
2.
From here, you can examine the breakpoint, edit or copy it, or disable it so that it is ignored the next time the program runs.
ARM DUI 0181B | Copyright © 2002 ARM Limited. All rights reserved. |