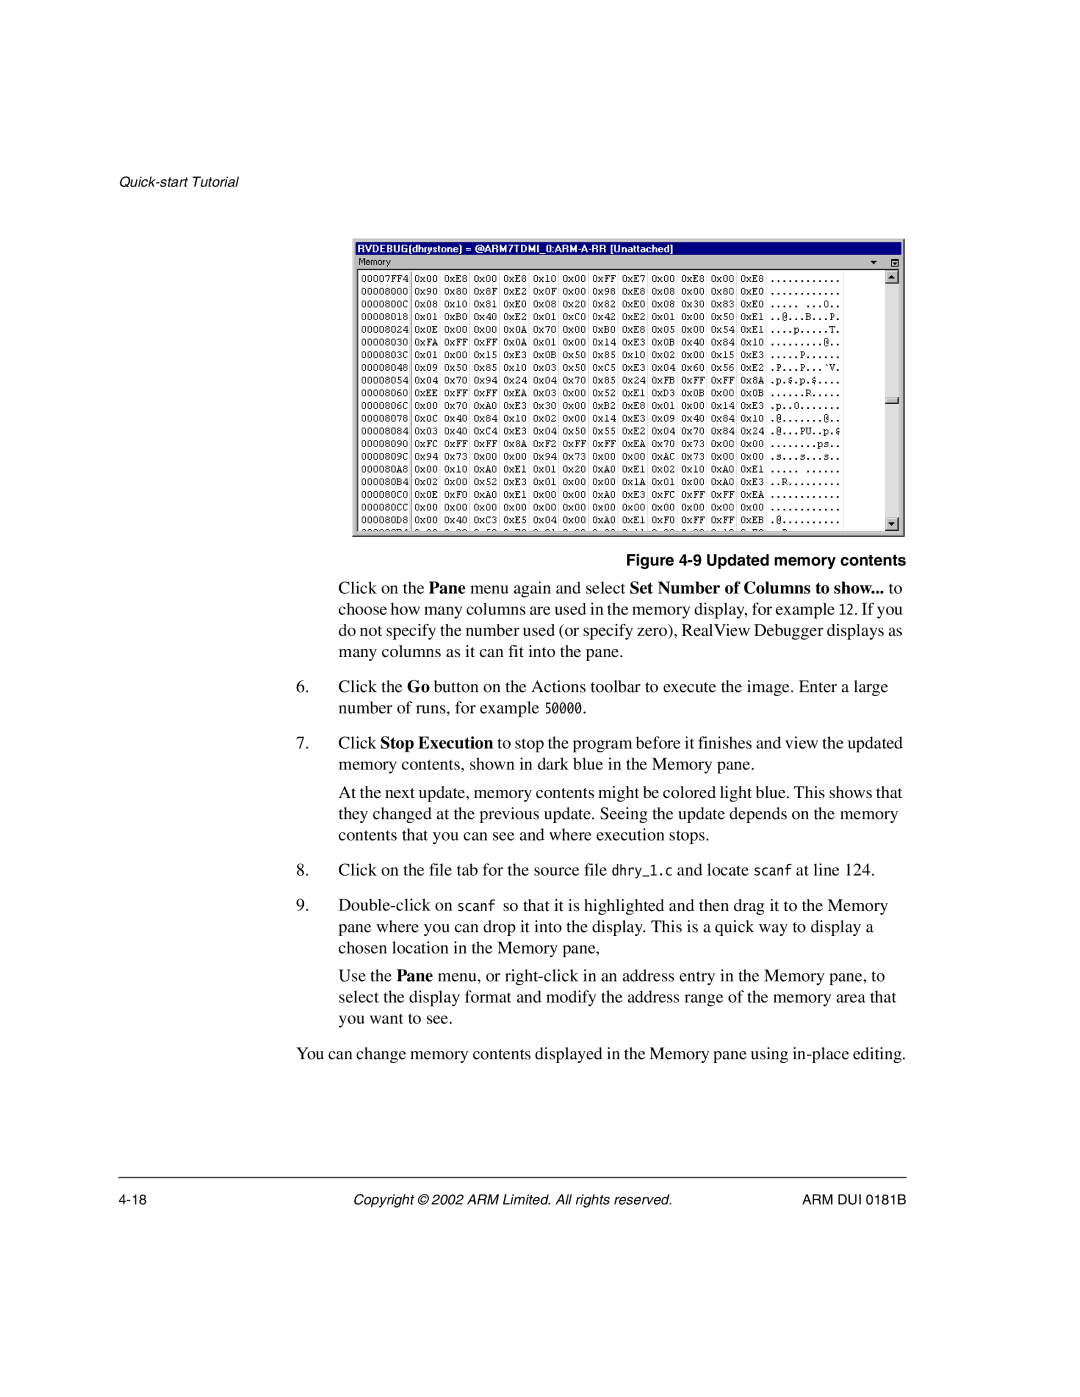
Figure 4-9 Updated memory contents
Click on the Pane menu again and select Set Number of Columns to show... to choose how many columns are used in the memory display, for example 12. If you do not specify the number used (or specify zero), RealView Debugger displays as many columns as it can fit into the pane.
6.Click the Go button on the Actions toolbar to execute the image. Enter a large number of runs, for example 50000.
7.Click Stop Execution to stop the program before it finishes and view the updated memory contents, shown in dark blue in the Memory pane.
At the next update, memory contents might be colored light blue. This shows that they changed at the previous update. Seeing the update depends on the memory contents that you can see and where execution stops.
8.Click on the file tab for the source file dhry_1.c and locate scanf at line 124.
9.
Use the Pane menu, or
You can change memory contents displayed in the Memory pane using
Copyright © 2002 ARM Limited. All rights reserved. | ARM DUI 0181B |