Getting Started with RealView Debugger
3.4.2What is shown in the title bar?
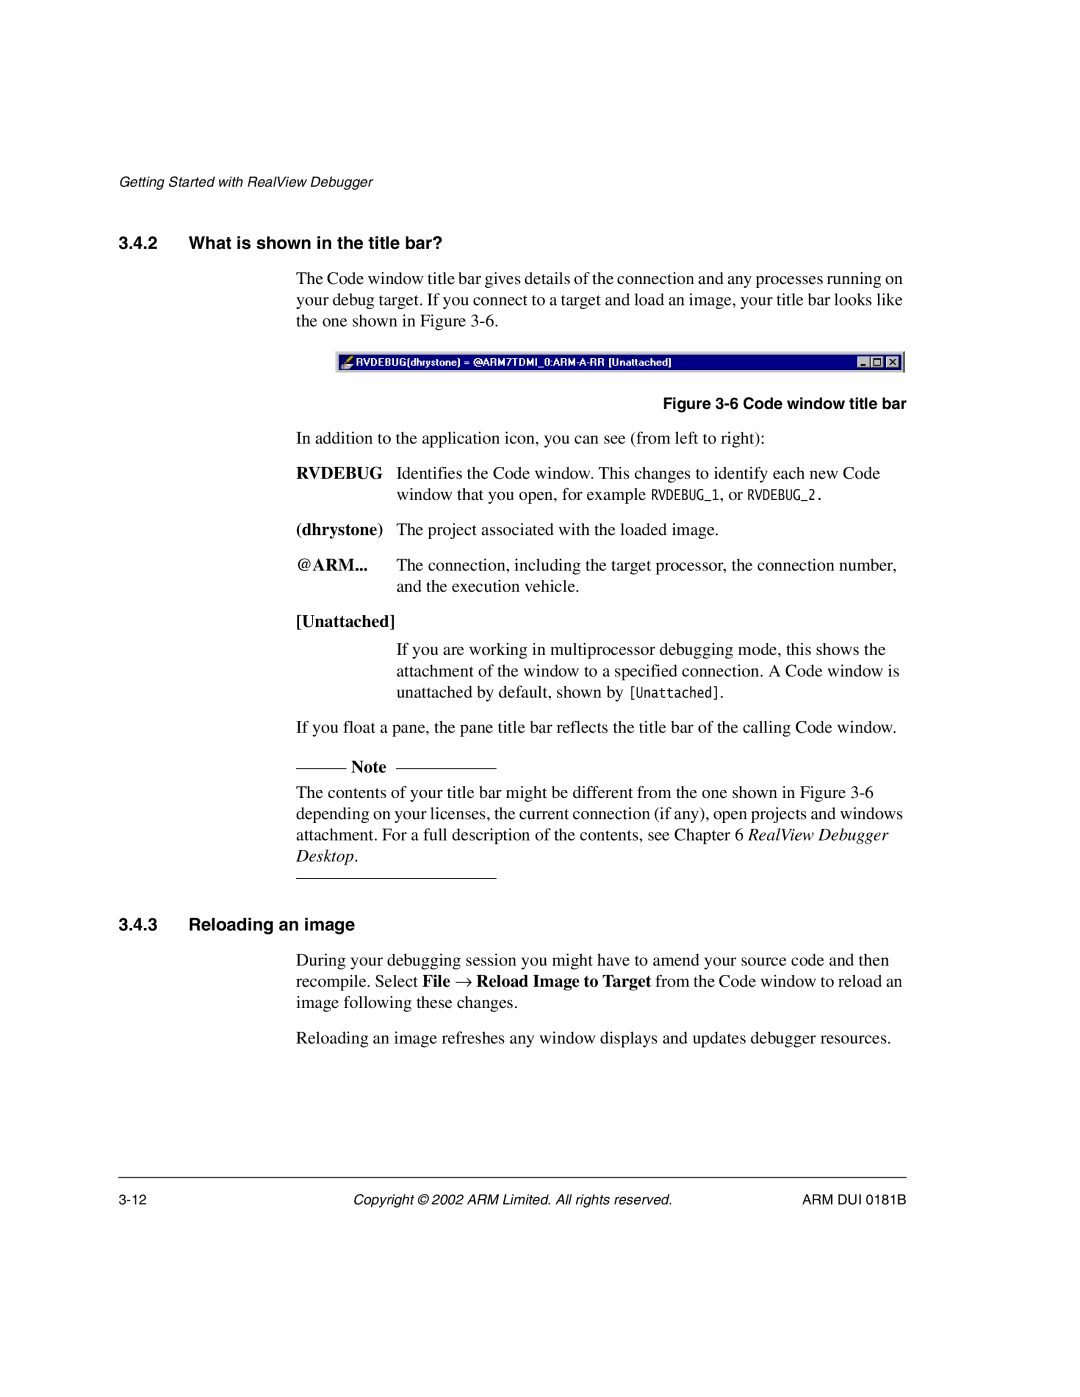
The Code window title bar gives details of the connection and any processes running on your debug target. If you connect to a target and load an image, your title bar looks like the one shown in Figure
Figure 3-6 Code window title bar
In addition to the application icon, you can see (from left to right):
RVDEBUG Identifies the Code window. This changes to identify each new Code window that you open, for example RVDEBUG_1, or RVDEBUG_2.
(dhrystone) The project associated with the loaded image.
@ARM... The connection, including the target processor, the connection number, and the execution vehicle.
[Unattached]
If you are working in multiprocessor debugging mode, this shows the attachment of the window to a specified connection. A Code window is unattached by default, shown by [Unattached].
If you float a pane, the pane title bar reflects the title bar of the calling Code window.
Note
The contents of your title bar might be different from the one shown in Figure
3.4.3Reloading an image
During your debugging session you might have to amend your source code and then recompile. Select File → Reload Image to Target from the Code window to reload an image following these changes.
Reloading an image refreshes any window displays and updates debugger resources.
Copyright © 2002 ARM Limited. All rights reserved. | ARM DUI 0181B |