RealView Debugger Desktop
6.7Analysis window
RealView Debugger includes Trace, Analysis and Profiling for use when debugging either single targets or multiple processes. If you have a Trace license, the Analysis window gives you access to these features.
You can set tracepoints for a trace capture from the Code window and then use the Analysis window to view and analyze the results of the capture. The Analysis window provides access to most of the tracing functionality and enables you to view the captured trace information using the available tabs.
If you are connected to an appropriate debug target, for example an
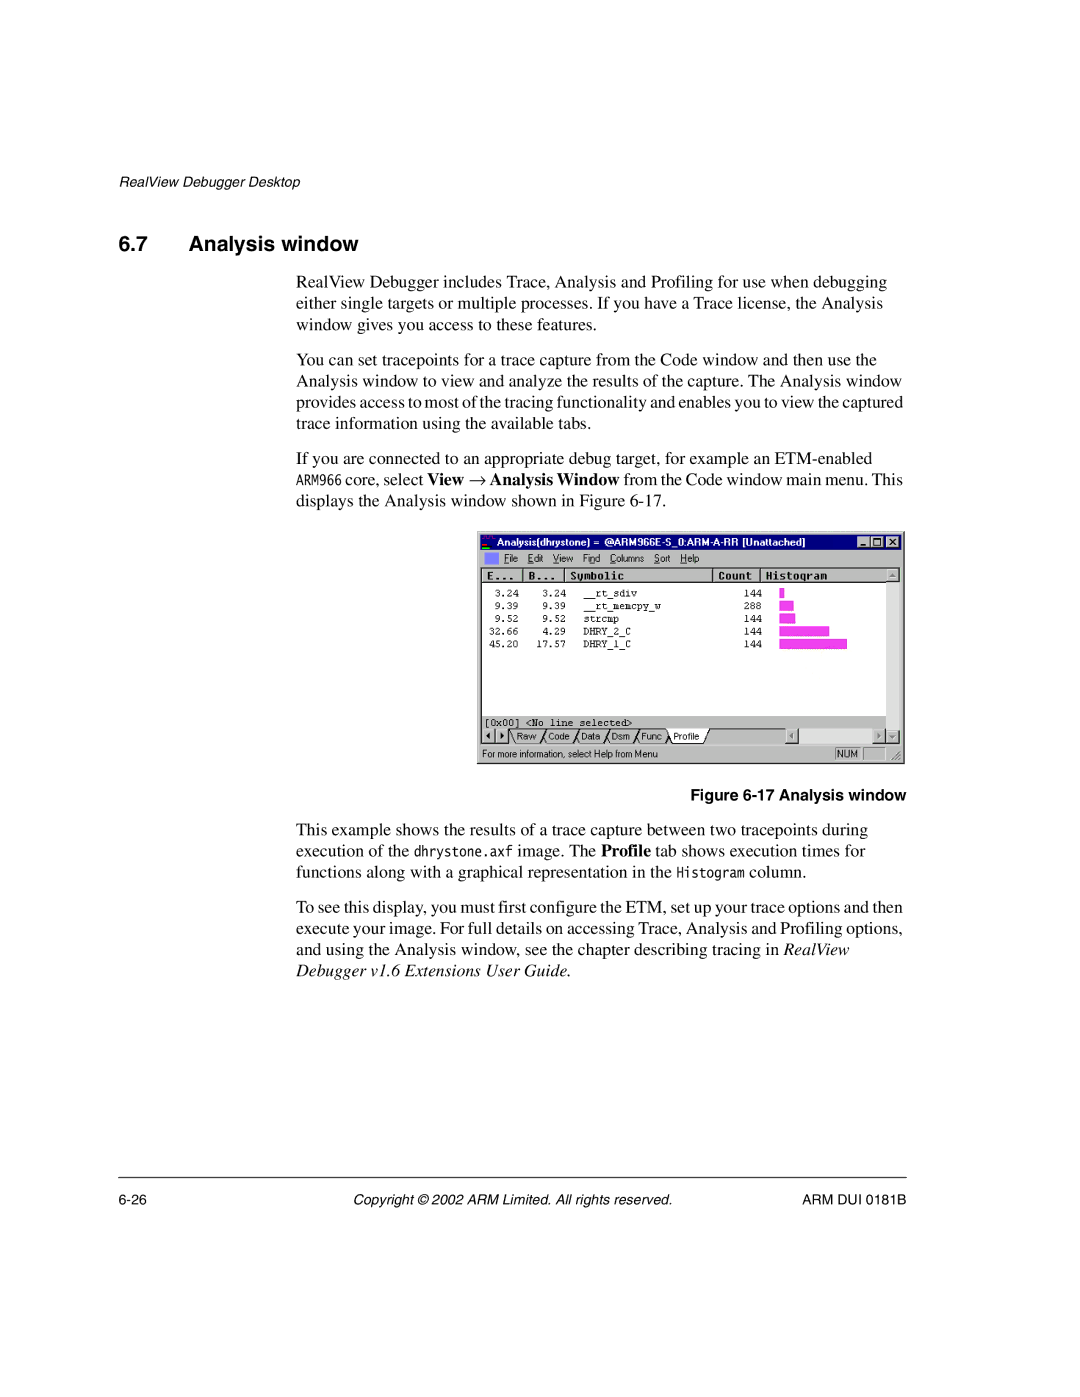
Figure 6-17 Analysis window
This example shows the results of a trace capture between two tracepoints during execution of the dhrystone.axf image. The Profile tab shows execution times for functions along with a graphical representation in the Histogram column.
To see this display, you must first configure the ETM, set up your trace options and then execute your image. For full details on accessing Trace, Analysis and Profiling options, and using the Analysis window, see the chapter describing tracing in RealView Debugger v1.6 Extensions User Guide.
Copyright © 2002 ARM Limited. All rights reserved. | ARM DUI 0181B |