RealView Debugger Desktop
Figure 6-3 Actions toolbar
Figure 6-4 Editing toolbar
To disable a toolbar, select View → Toolbars from the main menu. This displays the Toolbars menu where you can specify which toolbars are visible.
You can move a toolbar from the default position in the Code window so that it floats on your desktop. To restore the floating toolbar,
Note
Repositioning a toolbar in this way applies only to the calling Code window. If you create a new Code window the toolbars are in the default positions on opening.
See Working with button toolbars on page
6.1.6Color Box
Code windows in RealView Debugger are
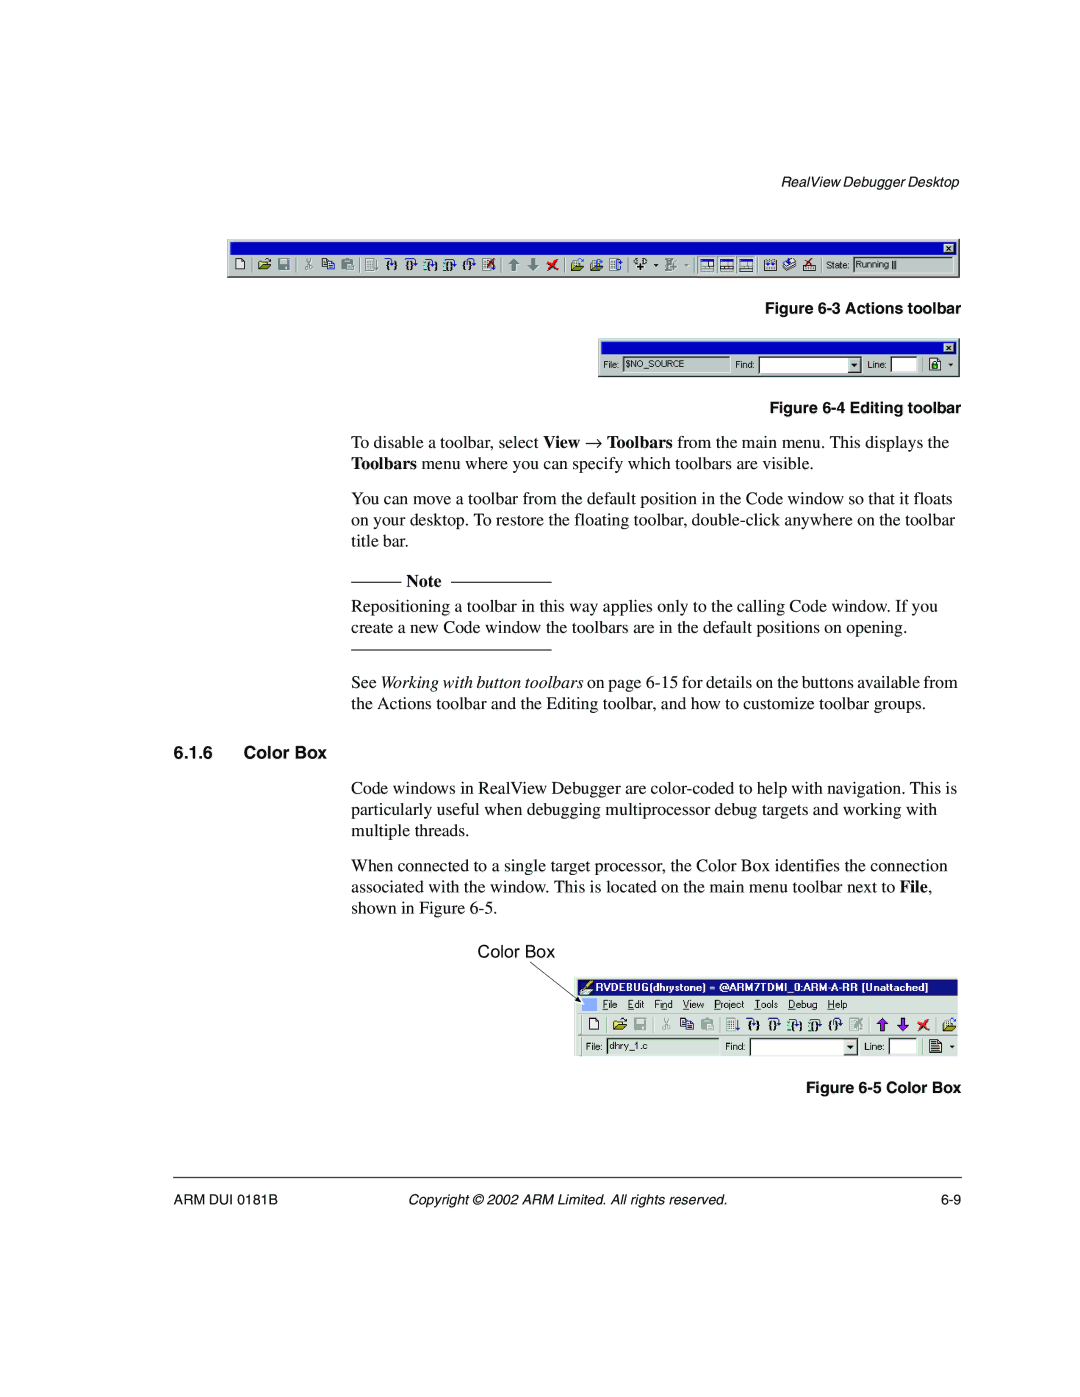
When connected to a single target processor, the Color Box identifies the connection associated with the window. This is located on the main menu toolbar next to File, shown in Figure
Color Box
Figure 6-5 Color Box
ARM DUI 0181B | Copyright © 2002 ARM Limited. All rights reserved. |