In this example, the value can also be changed by selecting FIQ from the list of values from the context menu shown in Figure
Process control
To display the Process Control pane:
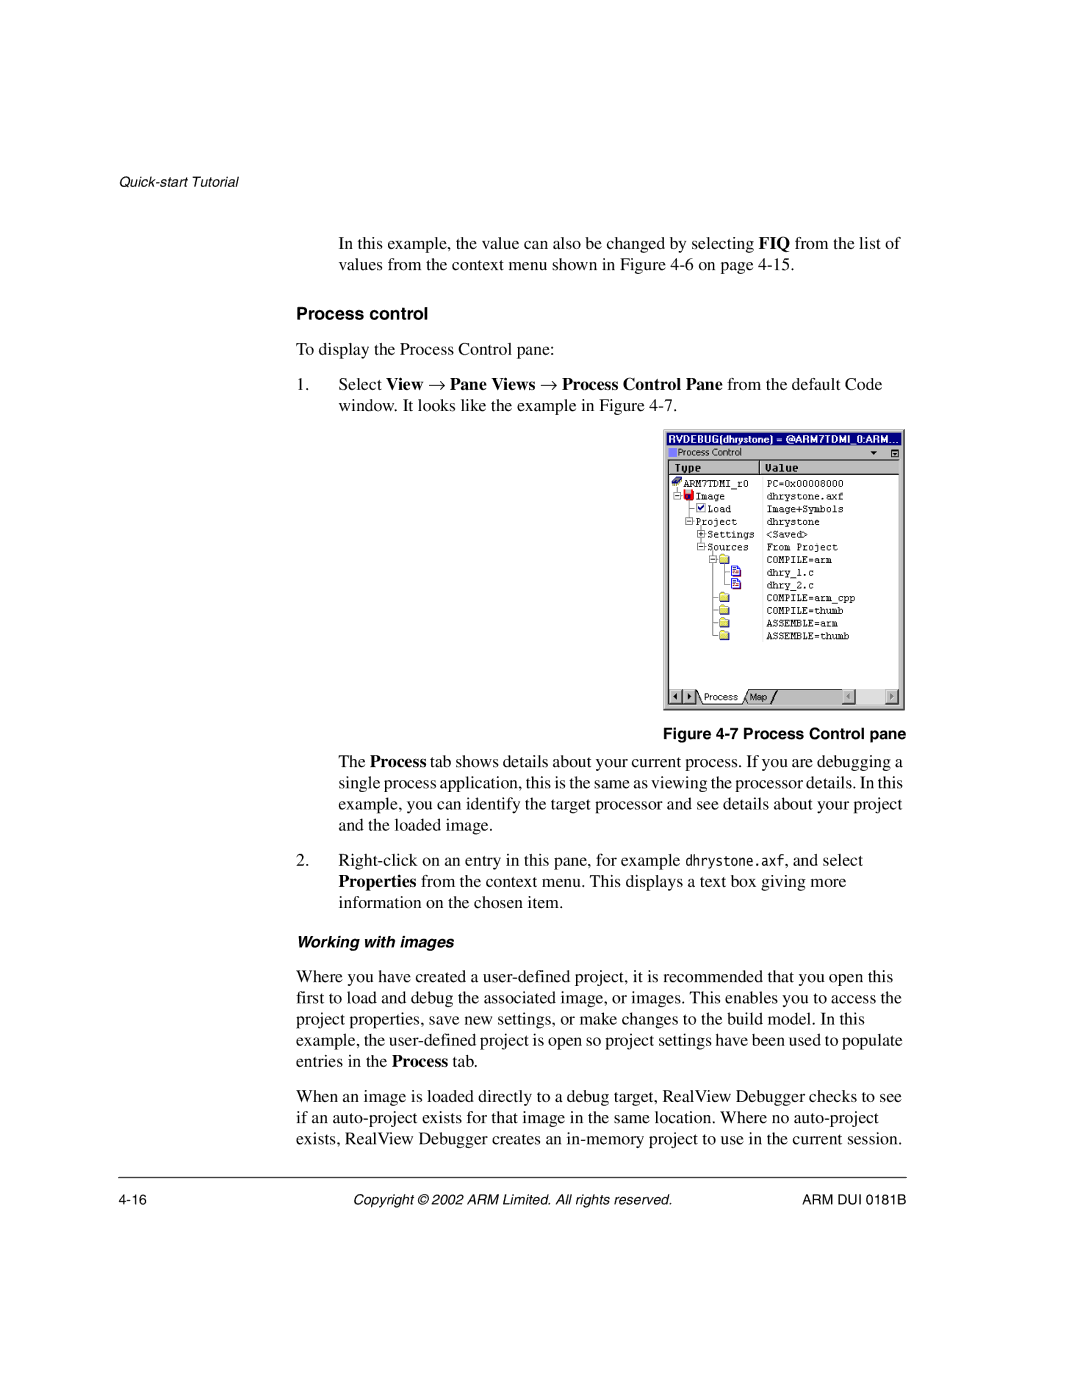
1.Select View → Pane Views → Process Control Pane from the default Code window. It looks like the example in Figure
Figure 4-7 Process Control pane
The Process tab shows details about your current process. If you are debugging a single process application, this is the same as viewing the processor details. In this example, you can identify the target processor and see details about your project and the loaded image.
2.
Working with images
Where you have created a
When an image is loaded directly to a debug target, RealView Debugger checks to see if an
Copyright © 2002 ARM Limited. All rights reserved. | ARM DUI 0181B |