Overview System Configuration
Restricted rights legend
Trademarks
Statement of conditions
General
Nortel Networks software license agreement
Page
Contents
System configuration software features
Getting Started with Device Manager 101
Using the Web-based management interface 145
System configuration using the CLI 177
Copyright 2007, Nortel Networks
Ethernet port management using the CLI 233
Configuring ports using Device Manager 303
Troubleshooting 337
Contents
Other changes
Features
Configuring daylight savings time using the device manager
New in this release
New in this release
This guide uses the following text conventions
Introduction
Before you begin
Text conventions
Bold body text
Introduction
Protocols menu
Related publications
Getting help through a Nortel distributor or reseller
How to get help
Getting help over the phone from a Nortel Solutions Center
Getting help from the Nortel web site
How to get help
Introduction
Front panel
Ethernet Routing Switch 2500 Series hardware
Ethernet Routing Switch 2526T front panel
Ethernet Routing Switch 2550T-PWR
Console port
Port connectors
SFP Gbic Support on the Ethernet Routing Switch 2500 Series
Gigabit Interface Converter
LED display panel
Auto-MDI/MDI-X
PWR
Kensington lock
Back panel
Label Type Color State Meaning
Cooling fans
AC power receptacle
Read immediately
Country/Plug Specifications Typical plug Description
Bitte sofort lesen
Leggere attentamente
Lisez ceci immédiatement
Sírvase leer inmediatamente
Avertissement
Network configuration examples
Small office desktop switch application
Ethernet Routing Switch 2500 Series used as a desktop switch
Branch office workgroup switch application
Configuring power workgroups and a wiring closet switch
Medium sized office wiring closet switch application
Configuring power workgroups and a wiring closet switch
Ethernet Routing Switch 2500 Series hardware
Stacking capabilities
Nortel Ethernet Routing Switch 2500 Series stacking
Stacking functionality delivery
Stack enabled switches
Standalone configuration with license files
Syntax for the copy tftp license command is
Working with license files using the CLI
Show license all command output
Copying the license file using the Java Device Manager
Step Action
License Download
Following table describes the fields on the License Download
License Download page fields Fields Description
Stack configuration
To set up a stack, do the following
Rear-ports mode command Show rear-ports mode command
Configuring the operational mode on rear ports using the CLI
Rear-ports mode command
Show rear-ports mode command
Rear panel components
Unit Select switch
Show rear-ports mode command output
Rear ports and stacking
Cascade Down port
Connecting stack cables
Cascade Up port
Base Unit Cascade Cable Cascade Cable used for return
Initial stack installation
Stack MAC address
Stack configurations
Cascade down stack configuration
Regardless of stack configuration, the following applies
Temporary base unit
Cascade up stack configuration
Redundant cascade stacking
Adding/Replacing a stack unit
Removing a stack unit
Redundant cascade stacking
Auto Unit Replacement
AUR function
CFG mirror process in stack
CFG mirror image process
CFG mirror images in the stack after adding unit
CFG mirror images after removing unit
CFG mirror images in the stack after removing the BU unit
Restoring a CFG image
Step Action
Synchronizing the CFG mirror images with CFG images
Configuring AUR using the CLI
Show stack auto-unit-replacement command
Syntax for this command is
No stack auto-unit-replacement enable command
Stack auto-unit-replacement enable command
Default stack auto-unit-replacement enable command
Displaying unit stack uptime
Configuring AUR using Device Manager
Nortel Ethernet Routing Switch 2500 Series stacking
Switch management features
System configuration software features
Configuration and switch management
Login banner
Console port settings
Switch banner
User name and password
Logging
Login screen
Using Sntp
Autosave feature
Using DNS to ping and Telnet
Setting local time zone
Configuring with CLI
Choosing a BootP request mode
BootP automatic IP configuration/MAC address
BootP or Default IP BootP Always BootP or Last Address
BootP or Default IP
BootP Always
BootP or Last Address
Flash memory storage Switch software image storage
BootP Disabled
BootP or Last Address
Default BootP setting
Requirements
Configuration File Download/Upload
Binary configuration file
Autotopology Link Layer Discovery Protocol Ieee 802.1ab
Ascii configuration file
Connectivity and management information
Lldp operational modes
How Lldp works
System configuration software features
Custom Autonegotiation Advertisements
Ethernet port management features
Configuring Lldp using the CLI
Autosensing and autonegotiation
High speed flow control
Symmetric mode
RFCs
Other features
Asymmetric mode
Rate Limiting Configuration
Standards
CLI Basics
CLI command modes
CLI command mode hierarchy
Command mode prompts and entrance/exit commands
Interface FastEthern
Port numbering
Port numbering in Standalone Mode
Ethernet Routing Switch 2500 Series banner
Accessing CLI
Press Ctrl+Y, and the CLI prompt appears
Getting help
Setting the system username and password
Basic navigation
End command Exit command Reload command Shutdown command
General navigation commands
Keystroke navigation
Help command
Help command output
No command
Default command
Logout command
Configure command parameters and variables
Enable command
Configure command
Interface command
Syntax for the end command is
Disable command
End command
Exit command
Exit command has no parameters or variables
Reload command
Shutdown command
Shutdown command parameters and variables
Parameters Description Variables
Show sys-info command
Show sys-info command Show tech command
Managing basic system information
Show sys-info command output
Show tech command
Show tech command output
Managing MAC address forwarding database table
Show mac-address-table command
Default mac-address-table aging-time command
Mac-address-table aging-time command
Show mac-address-table command output
CLI Basics
Installing Device Manager Device Manager basics
Installing Device Manager
Getting Started with Device Manager
Installing JDM on Windows Installing JDM on Unix or Linux
JDM installation precautions
Installing the Device Manager software
Installing JDM on Windows
Removing previous versions of JDM on Windows
Windows minimum requirements
Installing JDM on Windows from the web
Installing JDM on Windows from the CD
To access the JDM software from the installation CD
InstallAnywhere Introduction dialog box
Executing the JDM installation software on Windows
Click Next
Choose Install Set dialog box
License Agreement dialog box
Feature Sets dialog box
Click Next Choose Shortcut Folder dialog box appears
Choose Install Folder dialog box
Choose Shortcut Folder dialog box
Pre-Installation Summary dialog box
Install Complete dialog box
Installing JDM on Unix or Linux
Installing JDM on Linux from the CD
Installing JDM on Solaris from the CD
Minimum requirements
Installing JDM on Unix or Linux from the web
Executing the JDM installation software on Unix or Linux
Do one of the following
Click Next Choose Install Set dialog box appears
Feature Sets dialog box
Pre-Installation Summary dialog box appears
Installing Java Device Manager dialog box
Removing JDM in Unix or Linux environments
Starting Device Manager
Device Manager basics
Device Manager window
Setting the Device Manager properties
Properties dialog box fields Area
Default Properties dialog box
Type information and select check boxes Click OK
Following table describes the Properties dialog box fields
Application Control
Area Field Description
Polling
Web Management
From JDM
To display the device view, use the following procedure
Opening a device
Application Launch Telnet
Following table describes the Open Device dialog box fields
Press Ctrl+O Open Device dialog box appears
Field Description SNMPv3
Click Open
Device view
Device Manager window
Parts of the Device Manager window
Toolbar
Use the menu bar to set up and operate the Device Manager
Menu bar commands page 127 describes the Menu Bar commands
Menu bar
Selecting objects
Device view
Toolbar buttons Button Name Description Menu bar equivalent
To select a single object
Selecting a single object
Selecting multiple objects
Viewing information about a Gbic port
Interface tab
LEDs and ports
Color port legend
Switch unit shortcut menu
Shortcut menus
Port color codes Color Description
Port shortcut menu commands Command Description
Switch unit shortcut menu command Command Description
Port shortcut menu
Device Manager buttons Button Name Description
Using the buttons in Device Manager dialog boxes
Editing objects
Status bar
Types of statistics
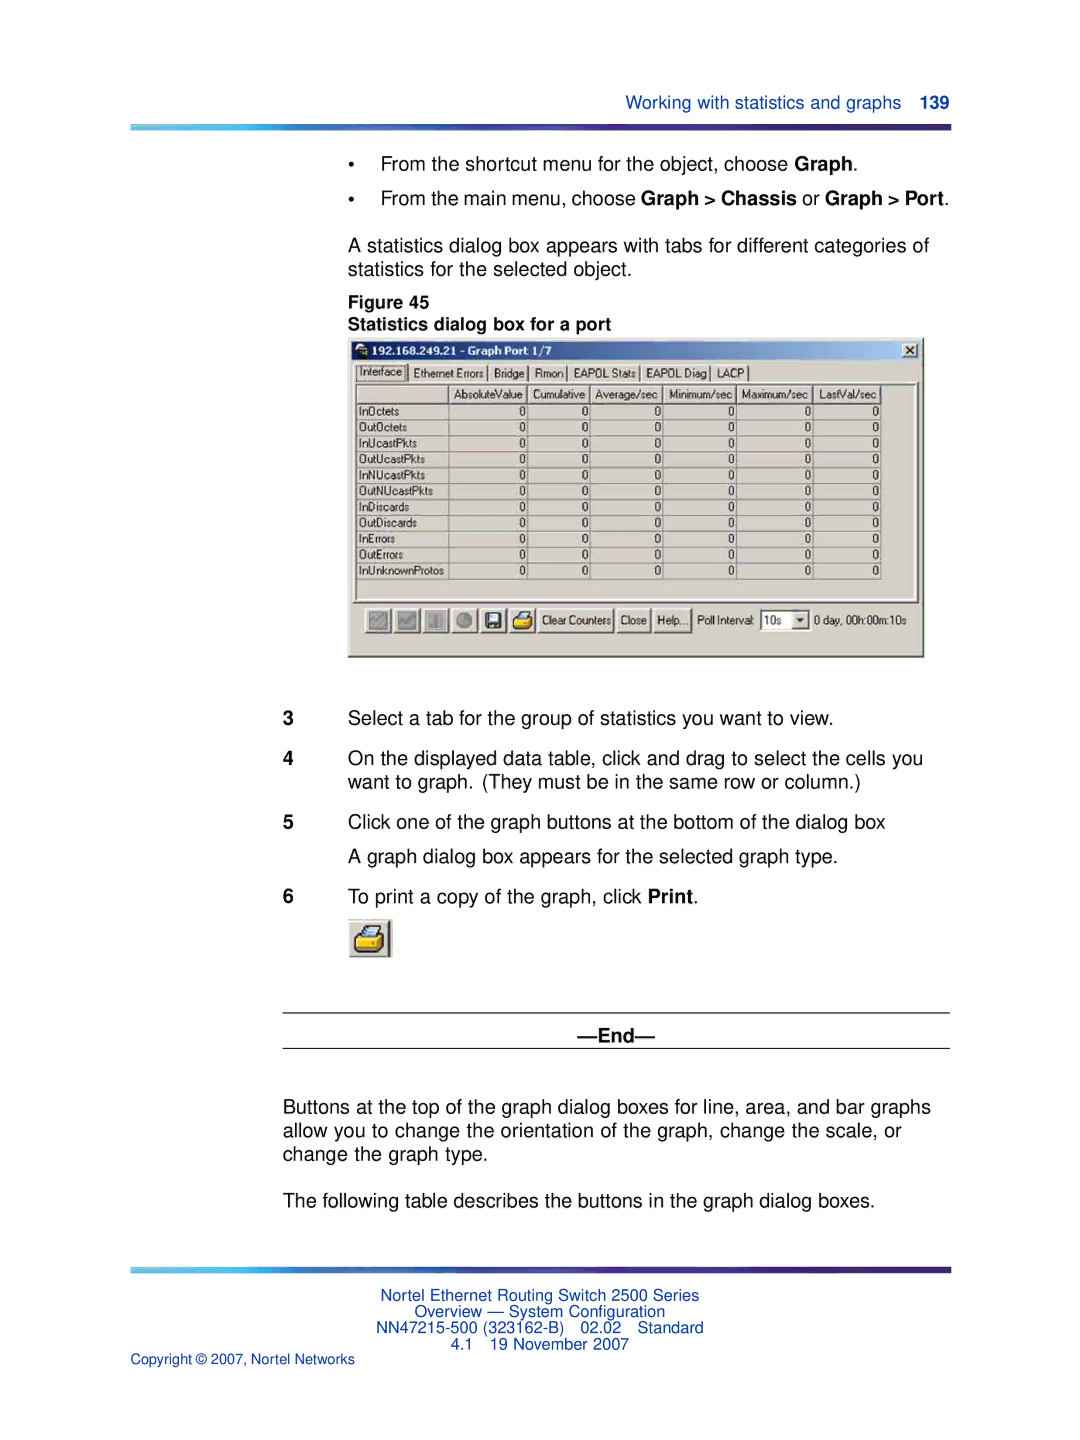
Working with statistics and graphs
Types of statistics Statistic Description
Statistic Description
Types of graphs
Line graph
Area graph Bar graph
Pie graph
Statistics for single and multiple objects
Interface statistics for a single port
Types of statistics Viewing statistics as graphs
Viewing statistics as graphs
Interface statistics for multiple ports
Statistics dialog box for a port
Opening an SSH connection to the device
Telnet session
Graph dialog box buttons Button Name Description
Opening the web-based management home
Web-based management home
Trap log
Online Help
Help file locations Platform Default path
Getting Started with Device Manager
Requirements
Using the Web-based management interface
Web-based management interface home
Logging in to the web-based management interface
Menu
Menu
Main headings and options Main menu titles Option
Adac
Main menu titles Option
Menu icons Button or icon Description
Management
Console
To view stack information
Viewing stack information
Icons Name Description
Stack Information screen fields Section Fields Description
Stack Information
Section Fields Description
Switch Information
Switch Information page fields Description
Viewing summary information
To view or renumber devices within the stack framework
Changing stack numbering
Stack Numbering
Stack Numbering screen fields Field Range Description
Identifying unit numbers
Identifying Unit Numbers
157
Status codes on PoE ports
Diagnosing and correcting PoE problems
Configuring PoE switch parameters using the CLI
Poe poe-pd-detect-type command
Legacy
Poe poe-power-usage-threshold command
No poe-shutdown command
Configuring PoE port parameters using the CLI
Poe poe-trap command
No poe-trap command
Poe poe-shutdown command
No poe-shutdown command
No poe-shutdown command parameters and variables
Poe poe-priority command parameters and variables
Poe poe-priority command
Poe poe-shutdown command parameters and variables
Syntax for the poe poe-prioritycommand is
Poe poe-limit command parameters and variables
Poe poe-limit command
Sets the port priority as
Show poe-main-status command
Displaying PoE configuration using the CLI
Show poe-port-status command parameters and variables
Show poe-port-status command
Status
Show poe-power-measurement command
Show poe-port-status command output
Enter the ports for which you want to display
Show poe-power-measurement command output
Configuring PoE using web-based management
Displaying and configuring power management for the switch
Power measurements
Global Power Management page items Description
Displaying and configuring power management for the switch
Displaying and configuring power management for the ports
Global Power Management
End
Port Property
Displaying and configuring power management for the ports
Port Property page appears Port Property
Following table describes the items on the Port Property
Description
PoE tab for a single unit
PoE tab items for a single unit Description
Edit Unit dialog box-PoE tab for a single unit
ERS 2550T-PWR with PoE ports
Device Manager display for PoE ports
Color Description
PoE tab for ports
Edit Port dialog box- PoE tab
PoE tab items page 176 describes the PoE tab items
PoE tab items
PoE tab items Description
IP notation
System configuration using the CLI
Ip address command parameters and variables
Ip address command
Assigning and clearing IP addresses
No ip netmask command
Default ip address command
No ip address command
Default ip netmask command
No ip default-gateway command
Ip default-gateway command
Ip default-gateway command parameters and variables
Show ip command
Default ip default-gateway command
Show ip address command output
Show ip address command
Show ip address command parameters and variables
Show ip command output
Ping command is executed in the User Exec command mode
Ping command
Pinging
Ping command responses
Resetting the switch to default configuration
Using DNS to ping and telnet
Show ip dns command Ping command Ip name-server command
Show ip dns command output
Show ip dns command
There is no default value for this command
Ip name-server command
No ip name-server command parameters and variables
No ip name-server command
Ip domain-name command
Ip name-server command parameters and variables
Configuration Management
No ip domain-name command
Default ip domain-name command
Configure network command
Configure network command parameters and variables
Configure network command
Show config-network command
Configure network command is executed in the User Exec mode
Show config-network command
Ascii Configuration Generator
Show running-config command
Show running-config command Copy running-config tftp command
Show config-network command output
Show running-config command output
Copy running-config tftp command
Show terminal command Terminal command
Setting the terminal
Show terminal command
Terminal command
Show cli command is executed in the User Exec command mode
Show cli command
Terminal command is executed in the User Exec mode
Terminal command parameters and variables
Show cli command output
Syntax for the show sys-infocommand is
Displaying system information
Ip bootp server command parameters and variables
Setting boot parameters
Boot command
Ip bootp server command
Default ip bootp server command
No ip bootp server command
Setting Tftp parameters
Tftp-server command parameters and variables
Show tftp-server command
Tftp-server command
Copy config tftp command Copy tftp config command
Copy config tftp command parameters and variables
No tftp-server command
Default tftp-server command
Copy config tftp command
Copy tftp config command parameters and variables
Copy tftp config command
Customizing the opening banner
Describes the parameters for the banner command
Banner command for displaying banner
Show banner command
Show banner command parameters and variables
Displaying the ARP table
No banner command
Show interfaces command
Show interfaces command Show interfaces config command
Show interfaces names command output
Show interfaces command parameters and variables
Show interfaces command output
Show interfaces verbose command output
Show interfaces config command
Saving the configuration to Nvram
Copy config nvram command
Write memory command
Show interfaces config command output
Show autosave command
Save config command
Enabling and disabling autosave
Show autosave command has no parameters or variables
Autosave enable command
No autosave enable command
Default autosave enable command
Show sntp command
Show sntp command output
Sntp enable command
No sntp enable command
Sntp server primary address command
No sntp server command parameters and variables
Sntp server secondary address command
No sntp server command
Default is
Sntp sync-interval command parameters and variables
Sntp sync-now command
Sntp sync-interval command
Syntax for the sntp sync-nowcommand is
Clock time-zone No clock time-zone Clock summer-time
Setting local time zone
Default sntp command
Default sntp command parameters and variables
Clock summer-time
Clock time-zone command parameters and variables
Clock time-zone
No clock time-zone
No clock summer-time
Clock summer-time command parameters and variables
Show clock time-zone
Show clock time-zone output
Autotopology command No autotopology command
Enabling Autopology
Show clock summer-time
Show autotopology settings
Autotopology command
No autotopology command
Default autotopology command
Show autotopology nmm-table
Configuring Lldp using the CLI
Show autotopology settings command output
Show autotopology nmm-table command output
32768
Lldp command
Lldp config-notification command parameters and variables
Default lldp command
Lldp config-notification command
Default lldp command parameters and variables
Default lldp config-notification command
No lldp config-notification command
Specifies the ports affected by the command
No lldp tx-tlv command parameters and variables
Lldp tx-tlv command
No lldp tx-tlv command
Lldp tx-tlv command parameters and variables
Lldp status command
Default lldp tx-tlv command
Default lldp tx-tlv command parameters and variables
No lldp status command parameters and variables
No lldp status command
Default lldp status command
Lldp status command parameters and variables
Show lldp command parameters and variables
Show lldp command
Default lldp status command parameters and variables
Show lldp command is executed in the User Exec command mode
Show lldp mgmt-sys-data command output
Show lldp local-sys-data command output
Show lldp port command parameters and variables
Show lldp port command
Show lldp stats command output
Show lldp port neighbor-mgmt-addr command output
Show lldp port neighbor command output
Show lldp port tx-stats command output
Show lldp port rx-stats command output
Configuring LEDs to blink on the display panel
Show lldp port tx-tlv command output
Upgrading software
Download command parameters and variables
Download command
Download command
Syntax for the download command is
Download message
System configuration using the CLI
Shutdown port command parameters and variables
Ethernet port management using
Shutdown command for the port
Shutdown command for the port No shutdown command
No shutdown command parameters and variables
No shutdown command
Shutdown port command output
Name command No name command Default name command
Name command
Naming ports
Default name command parameters and variables
No name command
Default name command
No name command parameters and variables
Speed command
Setting port speed
Default speed command parameters and variables
Default speed command
Default duplex command
Duplex command
Enabling flow control
flowcontrol command
Default duplex command parameters and variables
flowcontrol command parameters and variables
No flowcontrol command parameters and variables
No flowcontrol command
Default flowconrtol command parameters and variables
Default flowcontrol command
Enabling rate-limiting
Show rate-limit command output
Show rate-limit command
Rate-limit command
Rate-limit command parameters and variables
Default rate-limit command
No rate-limit command
Enabling Custom Autonegotiation Advertisements Cana
Enter ports for which you want the current
Show auto-negotiation-advertisements command
Show auto-negotiation-capabilities command
Show auto-negotiation-advertisements command output
Auto-negotiation-advertisements command
Default auto-negotiation-advertisements command
No auto-negotiation-advertisements command
Enter ports for which you want to set default
Viewing Unit information
Configuring the switch using Device Manager
To open the Unit tab
To open the Rate Limit tab, use the following procedure
Unit tab
Rate Limit tab
Rate Limit tab
Following table describes the Rate Limit tab fields
Rate Limit tab fields Field Description
Rear Ports Mode tab
Following table describes the Rear Port Mode tab items
RearPortOperMode
Following table describes the Globals tab fields
Viewing switch IP information
To open the Globals tab, use the following procedure
Globals tab
Edit IP dialog box IP Address tab
Addresses tab
Following table describes the Address tab fields
Globals tab fields Field and MIB Description Association
ARP tab fields Field Description
ARP tab
Following table describes the ARP tab fields
Edit IP dialog box ARP tab
TCP tab fields Field Description
TCP tab
Following table describes the TCP tab fields
TCP tab
UDP Listeners tab
TCP Connections tab
TCP Connections tab fields Field Description
UDP Listeners tab fields Field Description
Editing the chassis configuration
Edit Chassis dialog box System tab
System tab
System tab fields Field Description
Following table describes the System tab fields
Base Unit Info tab
Base Unit Info tab fields Field Description
Following table describes the Base Unit Info tab fields
Stack Info tab fields Field Description
Value is 4th flr wiring closet in blg a
Stack Info tab
Edit Chassis screen-Stack Info tab
264 Configuring the switch using Device Manager
Agent tab
Edit Chassis dialog box Agent tab
Following table describes the Agent tab fields
Agent tab fields Field Description
Power Supply tab fields Field Description
PowerSupply tab
Following table describes the PowerSupply tab fields
Edit Chassis dialog box PowerSupply tab
Following table describes the Fan tab fields
Fan tab
Edit Chassis dialog box Fan tab
Edit Chassis dialog box Banner tab
Banner tab
Telnet window with default banner
To set the default banner, use the following procedure
To disable the banner
To check that the banner is disabled
Custom Banner tab
To create a Custom Banner, use the following procedure
Edit Chassis dialog box Custom Banner tab
FileSystem Config/Image/Diag File tab dialog box
Working with configuration files
FileSystem dialog box
FileSystem Config/Image/Diag file dialog box fields
Ascii config file
File system Ascii Config File dialog box
Save Configuration tab
Ascii Config File tab fields Field Description
Save Config tab
Following table describes the Save Configuration tab fields
Save Configuration tab fields Field Description
Configuring Sntp
Working with Sntp
SNTPClock dialog box
SNTPClock dialog box fields Field Description
Following table describes the Sntp dialog box fields
Configuring daylight savings time using the device manager
Configuring local time zone using the device manager
Topology tab Topology Table tab
Displaying topology information using Device Manager
To view topology information, use the following procedure
Topology tab
Topology Table tab
Diagnostics dialog box Topology tab
Topology tab fields Field Description
Lldp Globals tab
Configuring Lldp using Device Manager
Diagnostics dialog box Topology Table tab
Following table describes the Topology Table tab fields
Lldp dialog box appears with the Globals tab displayed
Lldp Globals tab
Lldp Globals tab
Lldp Globals tab fields Field Description
284 Configuring the switch using Device Manager
Port tab
Following table describes the Port tab fields
Click the Port tab. The Port tab appears
Port tab fields Field Description
TX Stats tab
TX Stats tab fields Field Description
Graphing Lldp transmit statistics
Following table describes the TX Stats tab fields
TX Stats tab
Following table describes the RX Stats tab fields
RX Stats tab
RX Stats tab fields Field Description
290 Configuring the switch using Device Manager
Local System tab
Graphing Lldp receive statistics
Local System tab appears
Local System tab fields Field Description
Local Port tab
Following table describes the Local System tab fields
Local System tab
Local Port tab fields Field Description
Following table describes the Local Port tab fields
Local Management tab fields Field Description
Local Management tab
Following table describes the Local Management tab fields
Local Management tab
Neighbor tab
Neighbor tab fields Field Description
Following table describes the Neighbor tab fields
Neighbor Mgmt Address tab
Neighbor Mgmt Address tab fields Field Description
Neighbor Mgmt Address tab
Unknown TLV tab fields Field Description
Unknown TLV tab
Following table describes the Unknown TLV tab fields
Unknown TLV tab
Organizational Defined Info tab
Organizational Defined Info tab
Organizational Defined Info tab fields Field Description
Field Description
302 Configuring the switch using Device Manager
Viewing and editing a single port configuration
Configuring ports using Device Manager
Interface tab for a single port
Interface tab fields
Interface tab fields
Port dialog box Interface tab
Interface tab fields for a single port Field Description
To view or edit the configurations of multiple ports
Viewing and editing multiple port configurations
Interface tab for multiple ports
Interface tab for multiple ports
Interface tab fields for multiple ports Field Description
310 Configuring ports using Device Manager
Administrative options available to you are
Administering the switch using web-based management
Viewing system information
System Information
Quick Start
System Information page items Description
Quick Start
Items on the Quick Start Section Description
Configuring system security
Reset page message
Rebooting the Ethernet Routing Switch 2500 Series
From the main menu, choose Administration Reset
Reset warning message displays
Logging out of the management interface
Reset to Default page message
Logout message
Administering the switch using web-based management
Configuring BootP, IP, and gateway settings
Configuring the switch using web-based management
Switch configuration options available to you are
IP page items Section Range Description
Following table describes the items on the IP
Section Range Description
Configuring BootP, IP, and gateway settings
Modifying system settings
System page items Range Description
To configure system settings, use the following procedure
Type information in the text boxes Click Submit
Configuring switch port status
Range Description
Port Management
Following table describes the items on the Port Management
Click Submit
Port row of your choice, select from the lists
High Speed Flow Control
Configuring high speed flow control
High Speed Flow Control page items Range Description
To download a switch image, use the following procedure
Downloading switch images
Software Download
Software Download page fields Fields Range Description
Following table describes the fields on the Software Download
100 Mb/s port status LEDs ports 18 to
Downloading Ascii configuration files
Ascii Configuration file download page items Description
Ascii Configuration file download
Type information in the text boxes, or select from a list
Configuration File Setting items Range Description
Parameters not saved to the configuration file
From the main menu, choose Configuration Console/Comm Port
Configuring port communication speed
Console/Communication Port page items
Configuring Rate Limiting
Configuring Rate Limiting
Select from the list
Rate Limiting
Following table describes the items on the Rate Limiting
Rate Limiting page items Section Description
Normal power-up sequence Port connection problems
Troubleshooting
Diagnosing and correcting problems
Interpreting the LEDs Diagnosing and correcting problems
Normal power-up sequence
Corrective actions Symptom Probable cause
Port connection problems
Autonegotiation modes
Port interface
DB-9 Console port connector
Appendix a DB-9 RS-232-D Console/Comm Port connector
Ring indicator not used
Pin number Signal
Factory default settings Field Default setting
Appendix B Default settings
Field Default setting
Pvid
Packet Type Both Snooping Disabled
Field Default setting
Field Default setting
Field Default setting
Appendix B Default settings
Appendix C Sample BootP configuration file
Appendix C Sample BootP configuration file
CLI command list Command
Appendix D Command List
Security Configuration and Management
Nortel Ethernet Routing Switch
Default tftp-server command
Configuration IP Multicast NN47215-503
Ip default-gateway command
No autosave enable command
No banner command
No logging remote level
No snmp-server
No tftp-server command
Save config command
Show banner command
Show poe-port-status command
Show running-config command
Show terminal command
Show tftp-server command
Snmp-server host host-ip port
Spanning-tree mstp max-hop 100
Terminal command
Vlan create
Appendix D Command List
Environmental specifications
AC power specifications
Parameter Operating specification Storage specification
Appendix E Technical specifications
Performance specifications
Physical dimensions
Network protocol and standards compatibility
Electromagnetic emissions
Safety agency certification
Electromagnetic immunity
Index
Index
Eeprom
132
Gbic
Viewing 129 No banner command
No autotopology command
Index
Index
Sntp 68, 68, 208
181
Software version requirements
Unix
Index
Index
Page
Overview System Configuration