00809-0100-4530, Rev BA July
Reference Manual
Page
North American Response Center
Page
Table of Contents
Configuration
Electrical Installation
Operation
Service Troubleshooting
Reference Data
Safety Instrumented Systems 4-20 mA only
Appendix a
Appendix F
Appendix C
Appendix
Appendix G
Appendix H
Electrical shock could cause death or serious injury
Safety Messages
Section Introduction
Explosions could result in death or serious injury
Manual Overview
Service Support
Product RECYCLING/DISPOSAL
Transmitter Overview
Signal Amplitude Reference Pulse Level Interface Level Time
Applications
Tank
5303
Lead
Components of the Transmitter
½ NPT
M50 nut Cable Remote Connection
Dual Compartment Housing Bolt Bracket
Minimum load resistance 250 Ω within the loop is required
System Architecture
4-20 mA
20 mA/HART
Host/DCS system e.g. DeltaV
Foundation Fieldbus system architecture
Tank Environment Considerations
Probe Selection Guide
Rigid Single Flexible Single Coaxial
Flexible Twin
Constant
Transition Zones
Dielectric
Flexible Single Lead Coaxial
Bridging Foam Vapor Boiling Hydrocarbons
Process Characteristics
Sticky applications, periodic cleaning may be required
Coating
Minimum Dielectric Constant at Maximum Measuring Range
Measuring Range
Interface
Upper product dielectric constant
Flexible Single Lead Product
Lower product
Vessel Characteristics
Heating Coils, Agitators Tank Shape
Emulsion Layers
Follow these steps for proper installation
Installation
Procedure
Rosemount 5300 Series
Process leaks could result in death or serious injury
Mechanical Installation
Rosemount 5300 Series
Threaded Connection
Mounting
Considerations
Process Connection
Diameter D1 Recommended
Single Rigid/Flexible Coaxial
Recommended
Nozzle Diameter D
In./DN50
Installation of Single Lead Probes Non-metallic Vessels
Long Stud
Metal flange Ø2 Metal sheet
Metal
Installation in Concrete Silos
Considerations for Solid Applications
Pellets Cement
Mounting in Chamber/ Still Pipe
Material
Polypropylene
Probe Type Recommended Diameter Minimum Diameter
Rigid Single
Rosemount 5300 Series
Rosemount 5300 benefits
Considerations when changing to Rosemount
Replacing a Displacer An Existing Displacer Chamber
Required Probe Length Depending on Chamber Manufacturers
Free Space
Inlet pipe Agitator Heating coils
Mounting Position
Recommended Mounting for Solids
Hthp version Tank insulation
Ambient Temperature F C
Insulated Tanks
Transmitter head Nut Bolts Flange Probe Gasket Tank flange
Qualified personnel perform the installation
Flange Connection
Nut Tank connection Probe Sealant on threads or
Threaded Connection
Transmitter head Nut
Flange nut Bolts Probe Gasket Tank flange
Tri-Clamp Connection
Connect the transmitter head on the probe
Fasten the housing support to the bracket
Bracket Mounting
Mount the bracket to the pole
Rigid Single Lead
Shortening the Probe
Hthp Coaxial and Ptfe probes must not be shortened
Flexible Twin/Single Lead
Rigid Twin Lead
Centering piece is
Coaxial
Hthp coaxial probe must not
Be cut in field
Anchoring
Flexible Twin/Single Lead probe with weight and ring
Flexible Twin/Single Lead probe with weight and magnet
Weight with internal threads M8x14 Ring Magnet
Drain
Coaxial probe
Rigid Twin Lead probe
Flexible Single Lead probe
≥ 1cm/m
Solid Applications
Alternative chuck for Flexible Single Lead probes
Mounting a Centering Disc on Flexible Single Probes
Mounting a Centering Disc for Pipe Installations
Secure the split pin
Mounting a Centering Disc on Rigid Single Probes
Rigid Single Lead probe 13 mm
Bushing
Rigid Single Lead probe 8 mm
Rosemount 5300 Series
Electrical Installation
Avoid contact with leads and terminals
Hazardous Areas
CABLE/CONDUIT Entries Grounding Cable Selection
75 mA
Power Requirements Maximum Loop Resistance
Hart
Current
Connecting the Transmitter
Communicator Radar Transmitter AMS Suite Hart modem
Non-Intrinsically Safe Output
Field
Approved is Barrier
Is parameters1
Ui=30 Ii=130 mA Pi=1 W Ci=7.26 nF Li=0
Approval Type Power Supply Vdc
Power Requirements
Power supplies
Grounding Foundation Fieldbus
Shield Wire Ground
Connecting Fieldbus Devices
Non-Intrinsically Safe Output
Ui=17.5 Ii=380 mA Pi=5.32 W Ci=0 Li=0
Ui=30 Ii=300 mA Pi=1.5 W ATEX, 1.3 W FM Ci=7.26 nF Li=0
Fisco is parameters
Intrinsically Safe Barrier
Optional Devices
Tri-Loop Hart to analog converter
DIN Rail Mounted Hart Tri-Loop Burst Input to Tri-Loop
Field Signal Indicator
Section Configuration
Overview
Rosemount 5300 Series
Measurement Units Tank and Probe Geometry
Basic Configuration Parameters
Nozzle Height
Tank Height
Mounting Type
Inner Diameter
Rapid Level Changes
Measurement Mode
Tank Environment
Hold Off/Upper Null Zone
Strapping Table
Volume Configuration
Tank Type
Vertical Bullet
Standard Tank Shapes
Vertical Cylinder
Horizontal Cylinder
Upper/Lower Range Value
Output Source/Primary Variable
High 20.5 mA 22.5 mA
Alarm Mode
Level MA Saturation Values MA Alarm Value
High 20.8 mA
Basic Configuration Using a 375 Field Communicator
Process Variables
Setup
Diagnostics/Tools
Software
Basic Configuration Using Rosemount Radar Master
System Requirements Help In RRM
Hardware
Getting Started
Installing the RRM software for Hart communication
Restart the computer
Specifying the COM Port
To set the COM port buffers
Click the OK button
Installing the RRM Software for Foundation Fieldbus
Select the Measurement Units tab
Specifying Measurement Units
Using the Setup Functions
Run Wizard
Guided Setup
General Information
Device Properties
Probe
Geometry Hart command 2, 1 Foundation Fieldbus parameter
Dielectric Constant/Dielectric Range
Process Conditions
Rosemount 5300 Series
Tank Length
Volume
Volume Offset
Tank Diameter
Analog Output Hart
Finish Configuration Wizard
Device Specific Configuration
View Measured Values
Backup
Restart the Transmitter
Rosemount 5300 Series
Configure/Setup
Basic Configuration Using AMS Suite Hart
Basic Configuration Using Deltav
Rosemount 5300 Series
Rosemount 5300 Series
Transducer 1100MEASMODE
Tank Length Foundation Fieldbus parameter
Volume Offset Foundation Fieldbus parameter
See Volume Configuration on page 5-7for more information
Diameter Foundation Fieldbus parameter
Assigning Device Tag and Node Address
Foundation Fieldbus Overview
Register Transducer Block
Advanced Configuration Transducer Block
Foundation Fieldbus Block Operation
Level Transducer Block
Outd
Analog Input Block
Function Block Summary
AI Block
Configure the AI Block
Direct
Indirect
Ltype is Indirect
Indirect Square Root
Xdscale and Outscale
Ltype is Direct
Level Rate
Temperature
Signal Strength
Engineering Units
Radar Level Transmitter, Level Value
Solution
Parameter Configured Values
Application Example
Level Measurement percent
Radar Level Gauge, Level value in percent %
100% 46 ft 14 m
Function Block
100% 10ft 3 m 33 ft 10 m
Level Measurement
Function Block Interface Level Measurement
Variable Units
TRI-LOOP Hart to Analog Converter
Variables Assignment
Control Room
To turn off the Burst Mode
DIN Rail Mounted
Hart MULTI-DROP Configuration
Rosemount 5300 Series
Section Operation
Measurement value
Using the Display Panel
Error messages are listed in section LCD Error Messages on
Viewing Measurement Data
Specifying Display Panel Variables
Using a Handheld Communicator
Using Rosemount Radar Master RRM
Device Config General
LCD tab
Using AMS
Using DeltaV
Parameter Presentation on display Description
LCD Parameters
LCD parameters and presentation on display
Presentation Analog Output value in RRM
Viewing Measurement Data in RRM
Viewing Measurement Data in AMS Suite
Level values Interface Level values
Viewing Measurement Data in DeltaV
Rosemount 5300 Series
Foundation Fieldbus Error Messages
Service and Troubleshooting
Explosions could result in death or serious injury
Distance, m
Analyzing the Measurement Signal
Rosemount 5300 Series
Amplitude, mV
Surface Pulse not Found
As product Surface Distance, m
Probe End Projection
Amplitude, mV Disturbing Echo Actual surface
Disturbances at the Top of the Tank
Measurement signal
Disturbance Echo Handling
Amplitude Threshold Curve
Interface Pulse not Found
Amplitude, mV Distance, m
Signal Quality Metrics
Device Config Tools
Using the Echo Curve Analyzer
Using the Rosemount Radar Master
Measure and Learn Set threshold
Configuration Mode Tab
Measurement Output
Play
Record tank spectra Play continuously updates the spectrum
View/Record ModeTab
Advanced
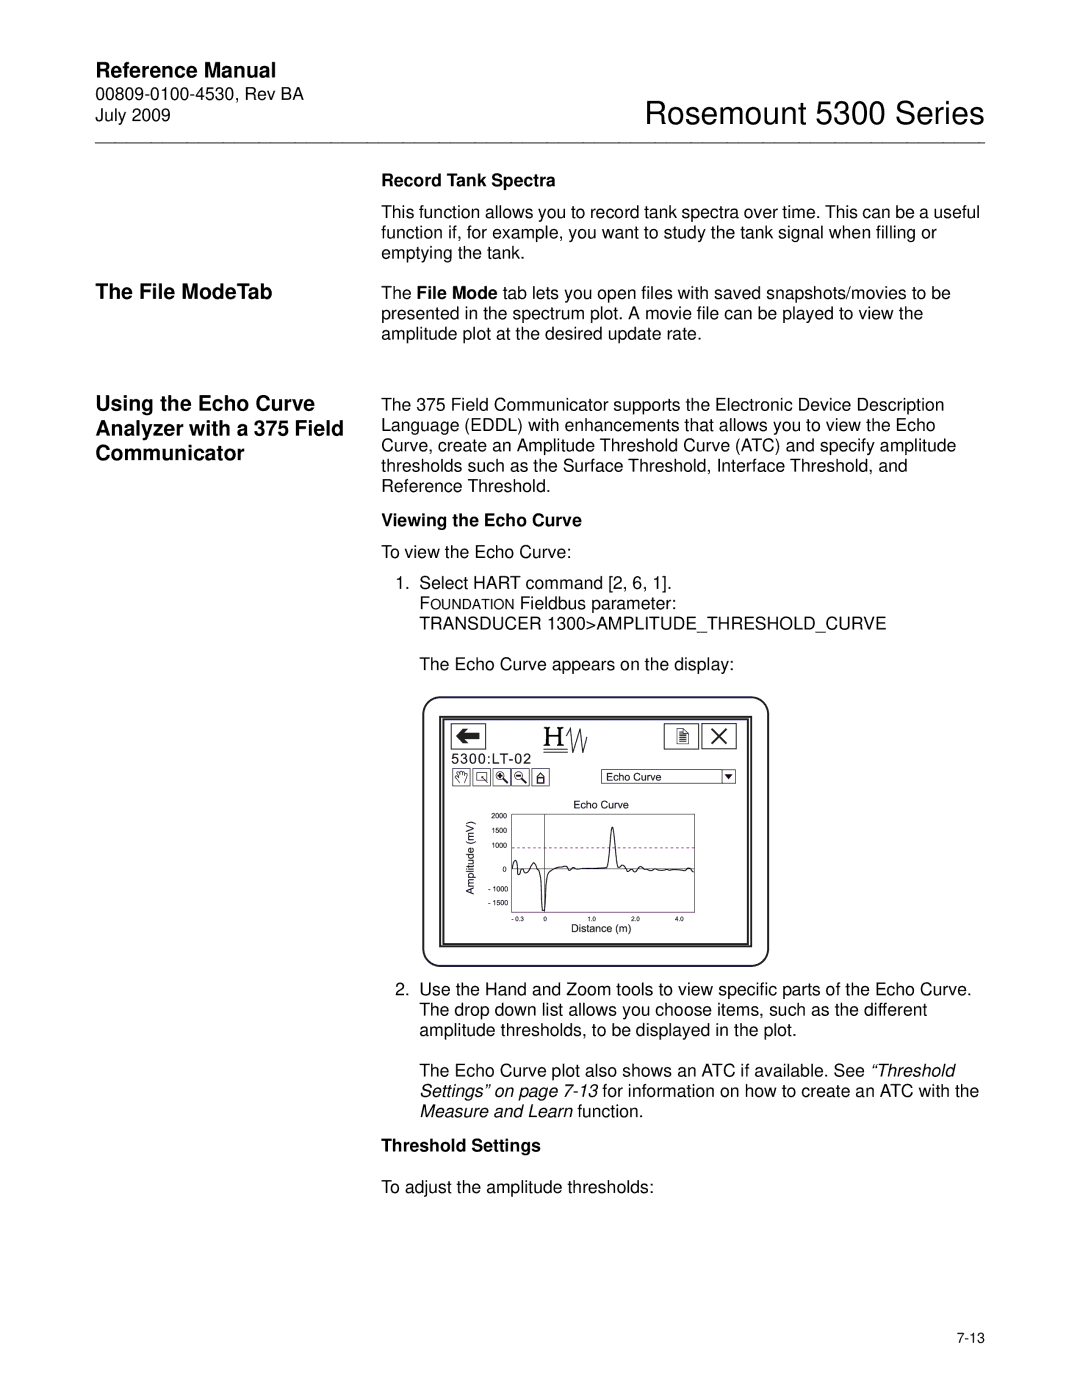
Viewing the Echo Curve
Threshold Settings
To adjust the amplitude thresholds
Record Tank Spectra
Rosemount 5300 Series
Product Level is ignored Interface Level is measured
Interface Measurements with Fully Submerged Probes
Interface Distance
Analog Output Calibration
Level calibration
Level and Distance Calibration
Distance calibration
Reference Point Distance Reference Gauge Height Level
12. Distance and Level calibration
Browse
Update rate Start Log
Logging Measurement Data
Backup File Reader
Backing UP Transmitter Configuration
Configuration Report
Factory Settings
Reset to Factory Settings
Choose the Factory Settings option
Rosemount Radar Master
Diagnostics
Status
Hart command
DeltaV
Mode
RRM choose menu option ToolsSimulation Mode
Choose the Simulation Mode option
Simulation Mode
Unlock/Lock
Enter Service Mode in RRM
Write Protecting a Transmitter
Choose the Unlock/Lock Device option
Viewing Input and Holding Registers
Put the protection Nut
Removing the Transmitter Head
Nut Put the protection
Plug here
Firmware Version
Changing a Probe
Probe and Firmware Compatibility
Check the R2, VC marking on the probe
Check Firmware and Probe Version
Check the manufacturing date on the transmitter head label
Transmitter Head Nut Process Seal Probe
Changing the Probe
Firmware Version Rigid Probes Flexible Probes
Near Zone
GWR Series Near Zone
3for information on possible causes
Diagnostic Messages
Troubleshooting Chart
Symptom Possible cause Action
Surface Pulse Not Found on
Message Description Action
Device Status
Errors are indicated in RRM in the Diagnostics window
Errors
Normally result in Analog Output alarm
RRM, warnings are indicated in the Diagnostics window
Alarms
Measurement Status
Rosemount 5300 Series
Interface Status
Volume Calculation Status
10. Analog Output Status
Analog Output Status
375 Handheld Communicator, or in RRM are shown in Table
Error Message Description
LCD Error Messages
For more information on errors, see Errors on
Error Message
Seconds
Code Error
Example
Flashing LED
14. Resource Block Summarystatus messages
Block Errors
Resource Block
13lists conditions reported in the Blockerr parameter
Condition Condition Name and Description
Power Up
Analog Input AI Function Block
17. Transducer Block Xderr messages
Symptom Possible Causes Recommended Actions
00809-0100-4530, Rev BA July 19. Troubleshooting AI block
Section
Safety Instrumented Systems 4-20 mA only
Rosemount 5300 Series
Prior-Use Option Model Codes
Safety Device QS Option
Applicable Models
Skill Level of Personnel
Hazardous Current
Functional Specifications Installation
Damping
Minimum input voltage Ui at different currents
General
Alarm and Saturation Levels
Operation and Maintenance
Write Protection Site Acceptance
Proof test
Spare Parts Terms and Definitions
References Specifications Failure Rate Data Useful Lifetime
Inspection
Rosemount 5300 Series
Measuring Performance
Display / Configuration
Appendix a Reference Data
General
Mechanical
Electric
Environment
Pressure psig bar
Process Temperature and Pressure Rating
Temperature F C
Temperature F C
Flange Rating Standards
Flange Connection Rating
JIS
Ambient Temperature
Fisher & Masoneilan
Remote
Remote Housing Measuring Range
Probe Type 4A, 4B
Dimensional
Dimensions are in inches millimeters
Drawings
½ 14 NPT Optional adapters M20x1.5, eurofast and minifast
10.1 15.6 In. s52 ½ in. s60
NPT 1/1½/2 inch
10.1
In. s60
Probe with Flange Connection
Probe Type 5A, 5B
Rosemount 5300 Series
Option W2 140 4 and 6 mm
Figure A-11. Flexible Single Lead with threaded connection
Probe Type 3A, 3B
Figure A-12. Coaxial probe with flange connection
10.1 In. s52 15.6 ½ in. s60
≤ 20 feet 6 m 1½ inch
S60 ≤ 10 feet 3 m 24 6 Ø 0.31 ½ in. s52 In. s60 10.2 Flange
Probe Type 1A
½ inch
NPT 1½ / 2 inch 10.2 ½ 14 NPT
≤ 164 feet 50 m Flange 10.2
Probe Type 2A
Pipe diameter max 2.5 in mm
Figure A-16. Bracket mounting
Figure A-17. Remote housing
Model Code 5301 and 5302 Level and/or Interface in Liquids
Ordering Information
Code Total Probe Length 13 in./cm
Code Probe Type Process Connection Probe Lengths
Code Probe Length Units
Code Total Probe Length 13 feet/m
Tri-Clamp Fittings14 Probe Type
EN DIN Flanges15
JIS Flanges15
Connections14 Probe Type
Qx Special Certifications
Special Configuration Software
Code Hazardous Locations Certifications
Code Options
Consolidate to Chamber
PlantWeb Diagnostic Functionality
Remote Housing Mounting
Centering Discs Outer Diameter
Code Total Probe Length 5 feet/m
Code Signal Output
Model Code 5303, Level for Solids
Model Product Description
Connections6 Probe Type
Flanges6
EN DIN Flanges7
JIS Flanges7
Special Certifications
3.2 ft. Remote Housing Mounting Cable and Bracket
Spare Parts
Spare parts list Transmitter head Model 5301/5302/5303
CSA Fisco Intrinsic Safety2
For other o-ring materials
Spare parts list Probe Model 5301/5302/5303
Code Material of Construction4 Process Probe Type
EN DIN Flanges13
Code Total Probe Length 12 feet/m
Code Total Probe Length 12 in./cm
Flanges15
Tri-Clamp Fittings15 Probe Type
EN DIN Flanges14
JIS Flanges13
Connections15 Probe Type
In. Centering disc21 In. Centering disc PTFE22
Centering discs1
Other accessories
Remote Housing / Bracket Mounting
Other spares
Rosemount 5300 Series
Rosemount 5300 Series
Appendix B Product Certifications
EU Conformity
Special Conditions for Safe Use
Intrinsic Safety
European Atex Directive Information
Rosemount 5300 Series
Rosemount 5300 Series
Flameproof
Rosemount 5300 Series
E3/HART I3/HART
E3/FIELDBUS I3/FIELDBUS
Rosemount 5300 Series
Factory Mutual FM Approvals
Rosemount 5300 Series
Explosion Proof
Dual seal annunciation
Dual seal maintenance
This product meets the Dual Seal Requirements of ANSI/ISA
Rosemount 5300 Series
Explosion Proof
Conditions of Certification
Iecex Approval
Rosemount 5300 Series
Rosemount 5300 Series
Flameproof
Rosemount 5300 Series
Combination Approvals Approval Drawings
Rosemount 5300 Series
Rosemount 5300 Series
Rosemount 5300 Series
Rosemount 5300 Series
Appendix C Advanced Configuration
Rosemount 5300 Series
Distance Offset Tank Height Product Level
Upper Reference Point Transmitter
Trim Near Zone
Using the Trim Near Zone Function
Handling of Disturbances from Nozzle
Trim Near Zone
Click Trim Near Zone
Figure C-3. Trim Near Zone using RRM
Rosemount 5300 Series
Figure C-4. Upper Null Zone
Changing the Upper Null Zone
Interface Threshold
Automatic Surface Threshold
Full Tank Threshold Offset
Reference Threshold
Probe End Threshold
Actual Probe End position Apparent Probe
Probe END Projection
Probe End pulse
Optional configurations
Figure C-10. Echo Tracking
Echo Tracking
Damping
Use Automatic Echo Tracking Settings
Vapor Dielectric Constant Lower Product Dielectric
Dielectric Constant Settings
Static Vapor Compensation
Lower Product
Dielectric constant
Temperature oF/oC Dielectric constant Pressure Pressure Bar
Dynamic Vapor Compensation
Vapor Compensation
VC marking on tank seal
Figure C-14. Single Rigid Hthp with VC marking on the probe
Figure C-15. Minimum requirements
Installation Setup
Click the Calibrate Vapor Compensation button
To calibrate Dynamic Vapor Compensation
Curve ATC
Signal Quality Metrics
Following diagnostics measurements are available
Surface Threshold=
Metrics in RRM
Viewing Signal Quality
Option and select the Signal Quality Metrics tab
Diagnostics Suite
Signal Quality Surface / Noise Margin
Appendix D Remote Mounting
Remote HOUSING, NEW Units
Connect the transmitter head on the housing support
Mount the probe housing on the probe
Remote CONNECTION, Field Retrofit
Remote Housing Configuration
Hart Sequence 2, 6
Appendix E Performing Proof Test
Performing Proof Test Field Communicator
Range 4mA
Enable write protection
Hart Sequence 3, 2, 1, 2
RRM Tools / Echo Curve
RRM Select Setup, Output from the menu
Alarm Mode AOut Loop test
Rosemount Radar Master RRM
Rosemount 5300 Series
AMS Suite
AMS Click Configure / Setup / Echo Curve
AMS Select Device Diagnostics / Tools from the left menu
AMS Select Configure / Setup, Analog Output from the menu
Rosemount 5300 Series
Channel Linearization
Appendix F Level Transducer Block
Definition
Transmitter
Table F-1. Channel Assignments
Channel Definitions
Parameters Descriptions
Channels for the Rosemount 5300 Series are the following
Transducertype
Geomtankheight
Maxupperproductthickness
Table F-3. Probe Type
Table F-7. LCD Parameters
00809-0100-4530, Rev BA July Table F-4. Device Mode
Table F-5. Environment
Table F-6. Presentation
Table F-8. Product Dielectrical Range
Table F-9. Measurement Mode
Unit Codes
Supported Units
Bit Number Value Description Corrective action
Diagnostics Device Errors
Rosemount 5300 Series
Parameter Index Description
Register Access Transducer Block Parameters
Table G-1. Register Access Transducer Block Parameters
Appendix G Register Transducer Block
Parameter Index Description Number
DBREG2FLOAT
Rosemount 5300 Series
Volume measurements
Appendix H Advanced Configuration Transducer Block
Advanced Configuration Transducer Block Parameters
Amplitudethresholdcurve
Volstraptablelength
Rosemount 5300 Series
Definition
Appendix I Resource Transducer Block
Overview Parameters and Descriptions
Cycletype
Maintpri
Saveconfignow
PlantWeb Alerts
Advisory Alarms
Maintenabled
Priority
Alarm Priority
Process Alarms Recommended Actions for PlantWeb Alerts
RB.RECOMMENDEDACTION
Figure J-1. Analog-Input Block
Appendix J Analog-Input Block
Parameter Index Units Description Number
Alarmhys
Device
Simulation
Damping
Figure J-2. Analog Input Function Block Schematic
Signal Conversion
Condition Condition Name and Description Number
Block Errors
Modes
Table J-2. Blockerr Conditions
Priority Number
Alarm Detection
Status Handling
Advanced Features
Configure the AI Block
Table J-5. Level Rate
Table J-8. Volume
Table J-6. Temperature
Table J-7. Signal Strength
Rosemount 5300 Series
Numerics
Index
Ioopts
Varindex
Index-4
Page
Emerson Process Management