Using the Console Interface
|
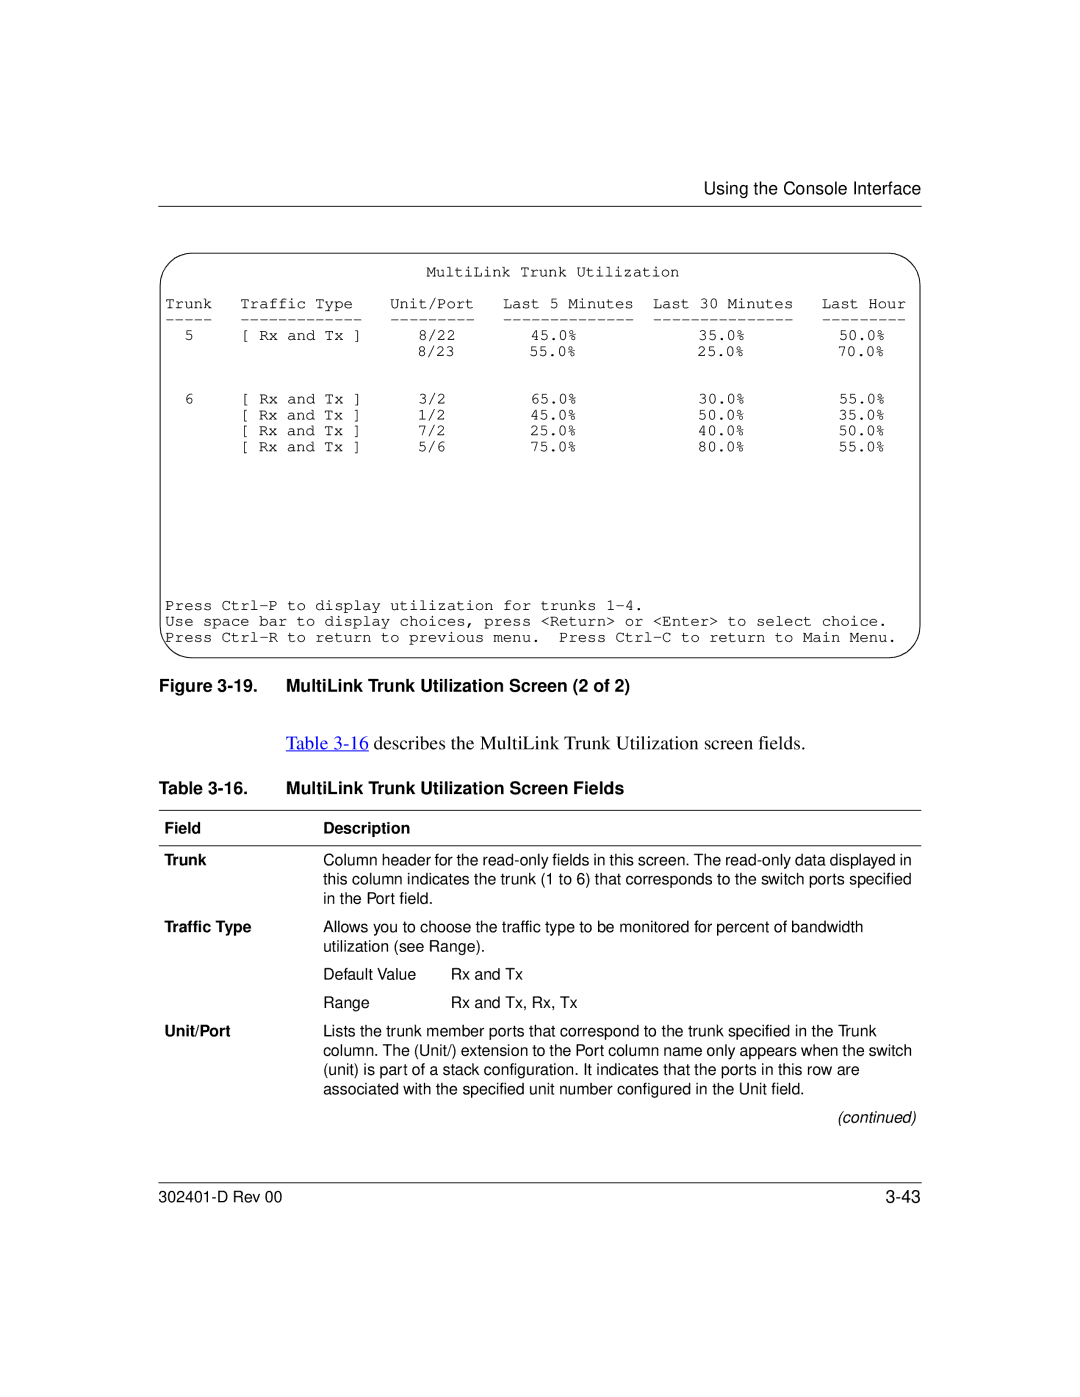
| MultiLink Trunk Utilization |
| ||
Trunk | Traffic Type | Unit/Port | Last 5 Minutes | Last 30 Minutes | Last Hour |
5 | [ Rx and Tx ] | 8/22 | 45.0% | 35.0% | 50.0% |
|
| 8/23 | 55.0% | 25.0% | 70.0% |
6 | [ Rx and Tx ] | 3/2 | 65.0% | 30.0% | 55.0% |
| [ Rx and Tx ] | 1/2 | 45.0% | 50.0% | 35.0% |
| [ Rx and Tx ] | 7/2 | 25.0% | 40.0% | 50.0% |
| [ Rx and Tx ] | 5/6 | 75.0% | 80.0% | 55.0% |
Press
Use space bar to display choices, press <Return> or <Enter> to select choice.
Figure 3-19. MultiLink Trunk Utilization Screen (2 of 2)
| Table | |
Table | MultiLink Trunk Utilization Screen Fields | |
|
|
|
Field | Description |
|
|
| |
Trunk | Column header for the | |
| this column indicates the trunk (1 to 6) that corresponds to the switch ports specified | |
| in the Port field. |
|
Traffic Type | Allows you to choose the traffic type to be monitored for percent of bandwidth | |
| utilization (see Range). | |
| Default Value | Rx and Tx |
| Range | Rx and Tx, Rx, Tx |
Unit/Port | Lists the trunk member ports that correspond to the trunk specified in the Trunk | |
| column. The (Unit/) extension to the Port column name only appears when the switch | |
| (unit) is part of a stack configuration. It indicates that the ports in this row are | |
| associated with the specified unit number configured in the Unit field. | |
|
| (continued) |
|
|
|
|
| |
