21. MAINTENANCE
21.1 Daily Inspection
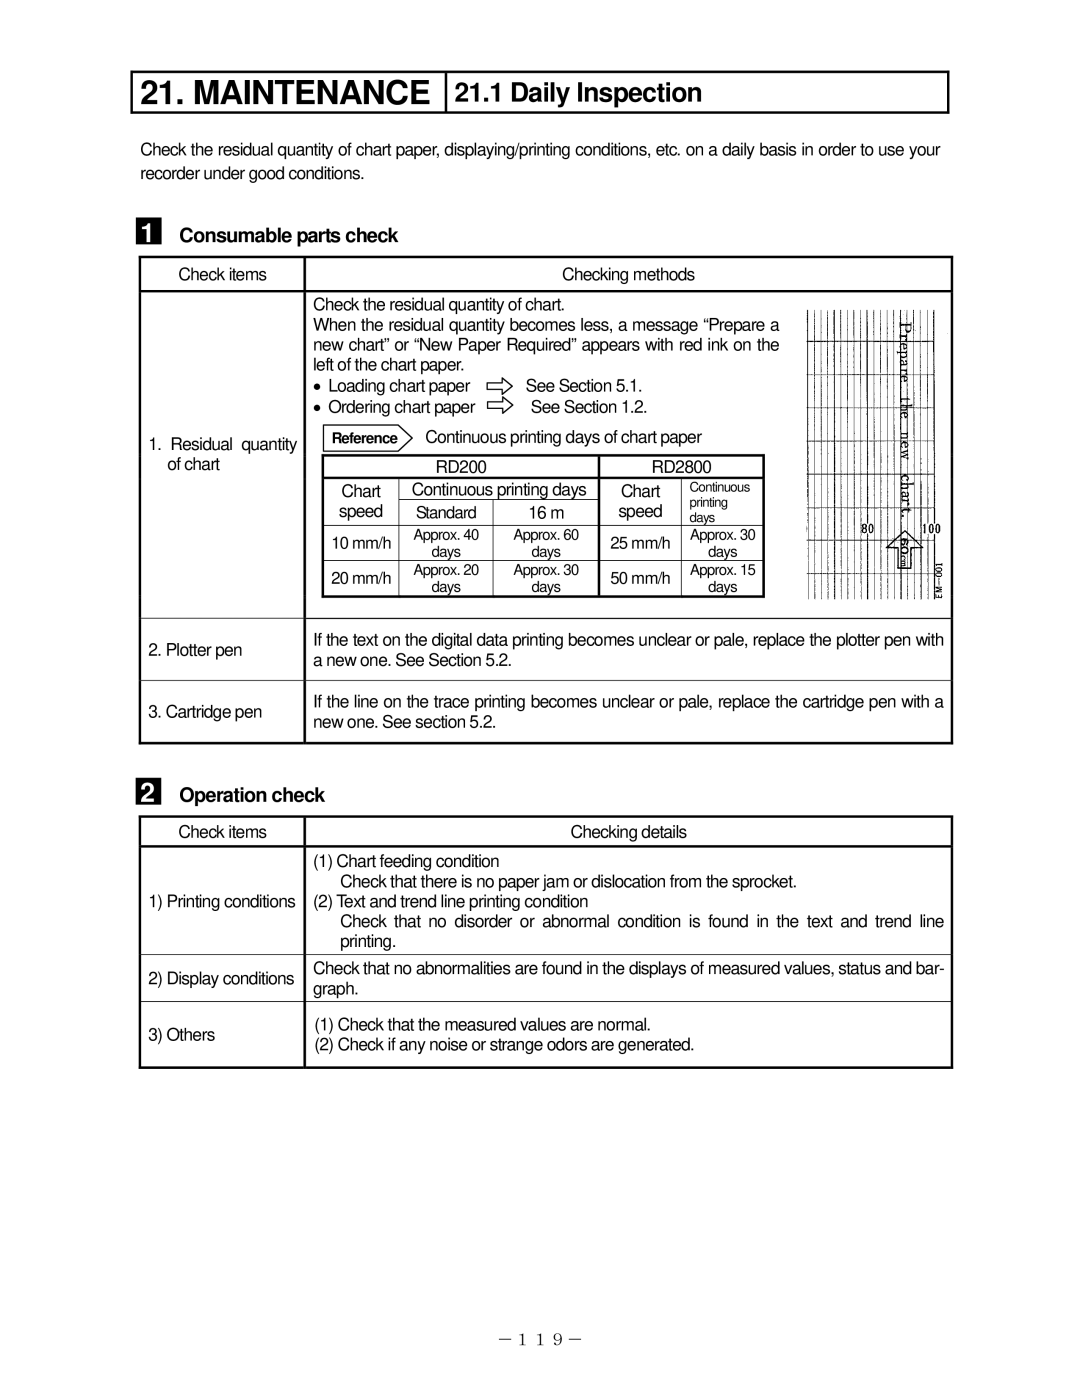
Check the residual quantity of chart paper, displaying/printing conditions, etc. on a daily basis in order to use your recorder under good conditions.
1
Consumable parts check
Check items |
|
|
|
| Checking methods | |||||||
|
|
|
|
|
|
|
|
|
|
|
| |
| Check the residual quantity of chart. |
|
|
|
|
|
|
| ||||
| When the residual quantity becomes less, a message “Prepare a |
|
| |||||||||
| new chart” or “New Paper Required” appears with red ink on the |
|
| |||||||||
| left of the chart paper. |
|
|
|
|
|
|
|
| |||
| • Loading chart paper | See Section 5.1. |
|
|
|
| ||||||
| • Ordering chart paper | See Section 1.2. |
|
|
|
| ||||||
1. Residual quantity |
| Reference | Continuous printing days of chart paper |
|
| |||||||
of chart |
|
| RD200 |
|
| RD2800 |
|
|
| |||
|
| Chart | Continuous printing days |
| Chart | Continuous |
|
|
| |||
|
| speed | Standard |
| 16 m |
| speed | printing |
|
|
| |
|
|
|
| days |
|
|
| |||||
|
| 10 mm/h | Approx. 40 |
| Approx. 60 |
| 25 mm/h | Approx. 30 |
|
|
| |
|
| days |
| days |
| days |
|
|
| |||
|
|
|
|
|
|
|
|
|
| |||
|
| 20 mm/h | Approx. 20 |
| Approx. 30 |
| 50 mm/h | Approx. 15 |
|
|
| |
|
| days |
| days |
| days |
|
|
| |||
|
|
|
|
|
|
|
|
|
| |||
|
|
|
|
|
|
|
|
|
|
|
|
|
2. Plotter pen | If the text on the digital data printing becomes unclear or pale, replace the plotter pen with | |||||||||||
a new one. See Section 5.2. |
|
|
|
|
|
|
|
| ||||
|
|
|
|
|
|
|
|
| ||||
|
|
|
| |||||||||
3. Cartridge pen | If the line on the trace printing becomes unclear or pale, replace the cartridge pen with a | |||||||||||
new one. See section 5.2. |
|
|
|
|
|
|
|
| ||||
|
|
|
|
|
|
|
|
| ||||
|
|
|
|
|
|
|
|
|
|
|
|
|
2
Operation check
Check items | Checking details | |
|
| |
| (1) Chart feeding condition | |
| Check that there is no paper jam or dislocation from the sprocket. | |
1) Printing conditions | (2) Text and trend line printing condition | |
| Check that no disorder or abnormal condition is found in the text and trend line | |
| printing. | |
2) Display conditions | Check that no abnormalities are found in the displays of measured values, status and bar- | |
graph. | ||
| ||
3) Others | (1) Check that the measured values are normal. | |
(2) Check if any noise or strange odors are generated. | ||
| ||
|
|
-119-
