Chapter 6: Configuration
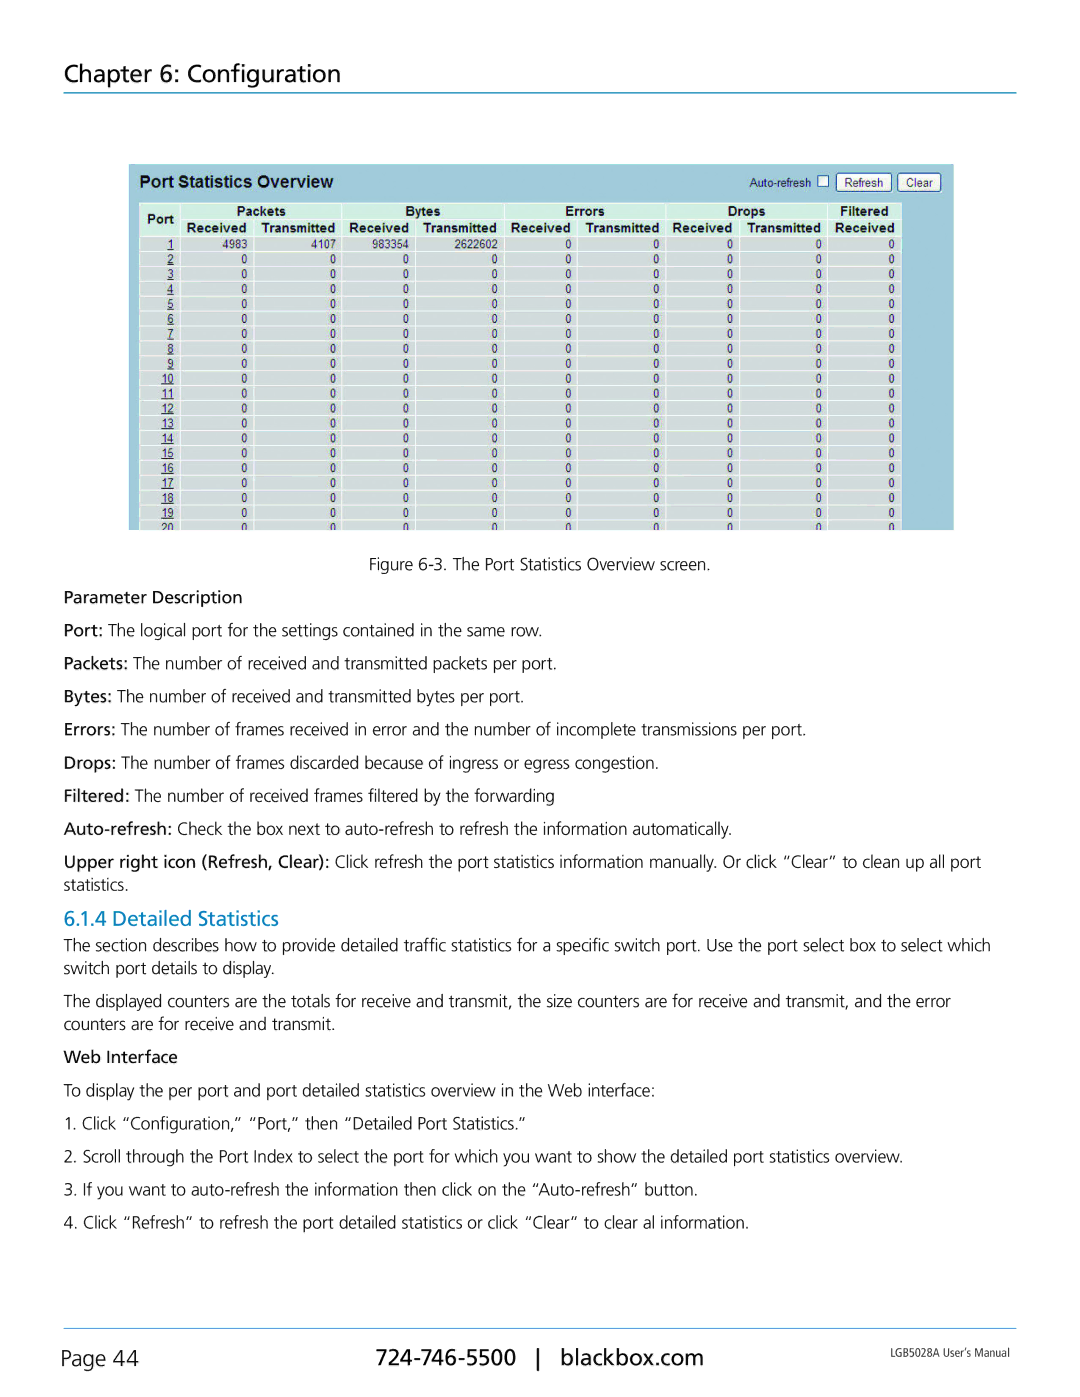
Figure 6-3. The Port Statistics Overview screen.
Parameter Description
Port: The logical port for the settings contained in the same row.
Packets: The number of received and transmitted packets per port.
Bytes: The number of received and transmitted bytes per port.
Errors: The number of frames received in error and the number of incomplete transmissions per port.
Drops: The number of frames discarded because of ingress or egress congestion.
Filtered: The number of received frames filtered by the forwarding
Auto-refresh: Check the box next to auto-refresh to refresh the information automatically.
Upper right icon (Refresh, Clear): Click refresh the port statistics information manually. Or click “Clear” to clean up all port statistics.
6.1.4 Detailed Statistics
The section describes how to provide detailed traffic statistics for a specific switch port. Use the port select box to select which switch port details to display.
The displayed counters are the totals for receive and transmit, the size counters are for receive and transmit, and the error counters are for receive and transmit.
Web Interface
To display the per port and port detailed statistics overview in the Web interface:
1.Click “Configuration,” “Port,” then “Detailed Port Statistics.”
2.Scroll through the Port Index to select the port for which you want to show the detailed port statistics overview.
3.If you want to
4.Click “Refresh” to refresh the port detailed statistics or click “Clear” to clear al information.
Page 44 | LGB5028A User‘s Manual | |
|
|
