19.5 Overall View
19.5 Overall View
The Overall tab provides overall statistics for all users within the local network (includ- ing anonymous, i.e. unauthenticated users) for the selected accounting period.
Traffic by periods
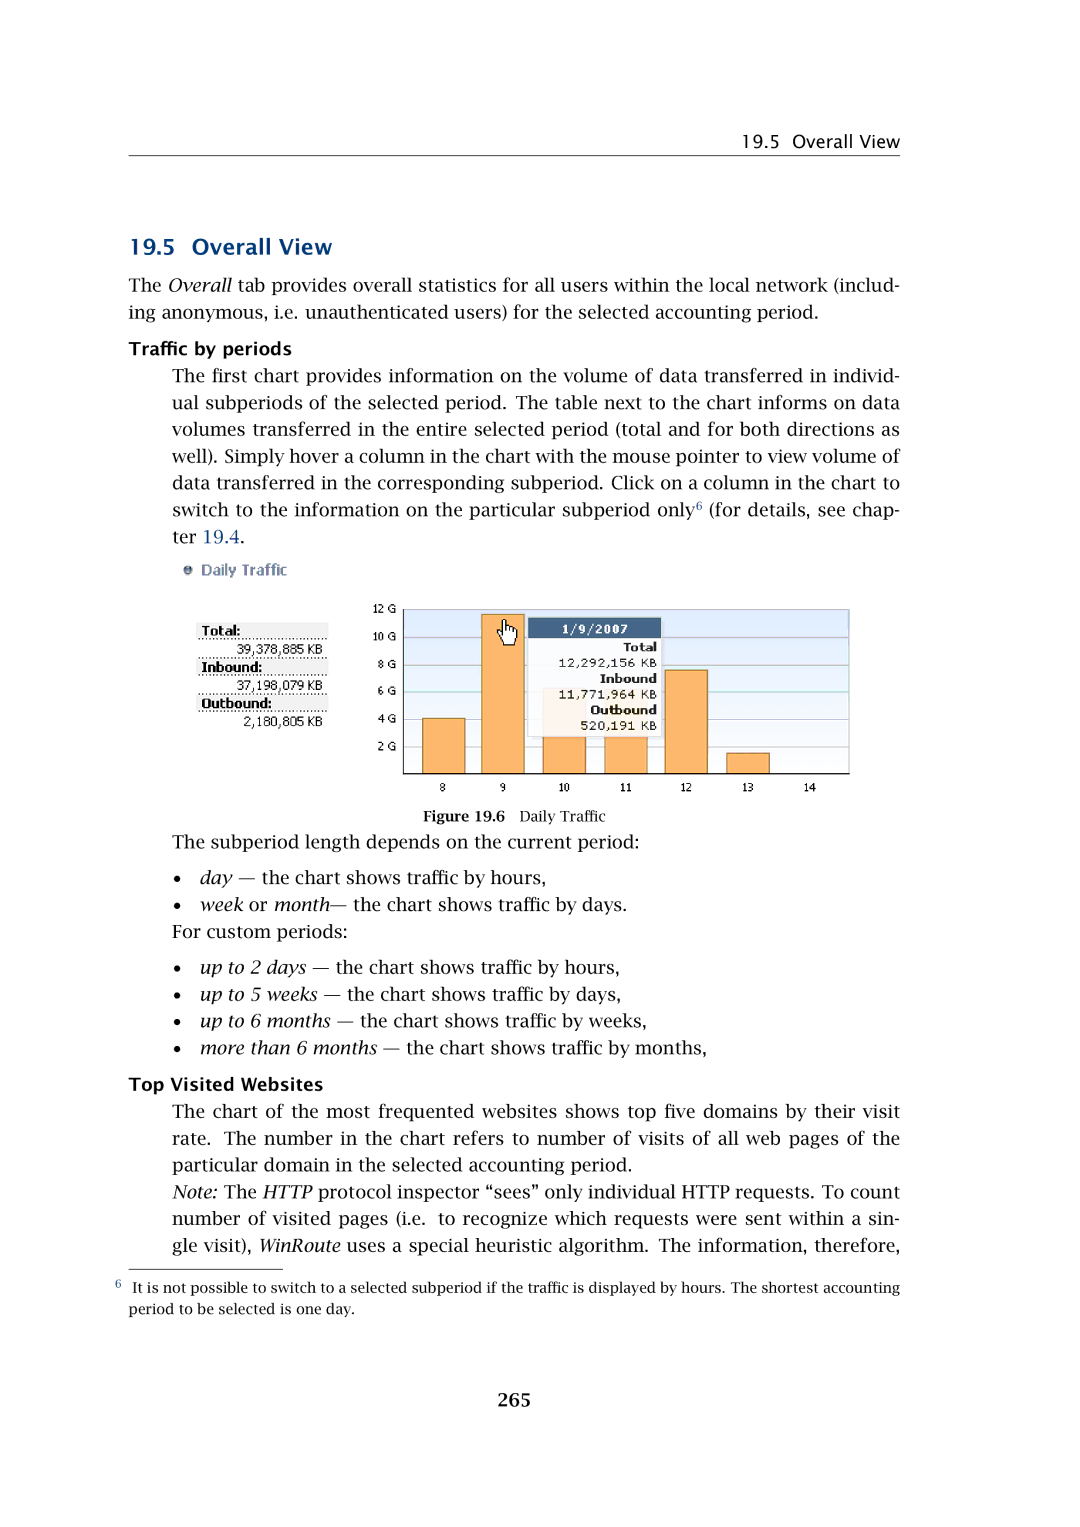
The first chart provides information on the volume of data transferred in individ- ual subperiods of the selected period. The table next to the chart informs on data volumes transferred in the entire selected period (total and for both directions as well). Simply hover a column in the chart with the mouse pointer to view volume of data transferred in the corresponding subperiod. Click on a column in the chart to switch to the information on the particular subperiod only6 (for details, see chap- ter 19.4.
Figure 19.6 Daily Traffic
The subperiod length depends on the current period:
•day — the chart shows traffic by hours,
•week or month— the chart shows traffic by days. For custom periods:
•up to 2 days — the chart shows traffic by hours,
•up to 5 weeks — the chart shows traffic by days,
•up to 6 months — the chart shows traffic by weeks,
•more than 6 months — the chart shows traffic by months,
Top Visited Websites
The chart of the most frequented websites shows top five domains by their visit rate. The number in the chart refers to number of visits of all web pages of the particular domain in the selected accounting period.
Note: The HTTP protocol inspector “sees” only individual HTTP requests. To count number of visited pages (i.e. to recognize which requests were sent within a sin- gle visit), WinRoute uses a special heuristic algorithm. The information, therefore,
6It is not possible to switch to a selected subperiod if the traffic is displayed by hours. The shortest accounting period to be selected is one day.