3CRWXR10095A, 3CRWX120695A, 3CRWX440095A
Wireless LAN Mobility System
United States Government Legend
3Com Corporation 350 Campus Drive Marlborough, MA USA
Contents
Starting 3WXM
Site Objects Alerts Panel Content Panel Monitor Tab
130
Planning the 3COM Mobility System
210
Configuring WX System and Administrative Parameters
245
Configuring IP Aliases
Configuring DNS 230 Configuring NTP 231 Configuring ARP 233
226
300
268
Creating and Managing Users in the Local User Database
285
Managing Certificates
397
361 Displaying 802.11 Coverage 362
364
394
430
423
448 Generating a Radio Details Report 449
Using 3WXM with HP Openview
Register Your Product 497
Obtaining Support for Your Product
Page
List conventions that are used throughout this guide
Conventions
Icon Description
This manual uses the following text and syntax conventions
Including new features and bug fixes
3WXM for advanced configuration and management
Documentation
Pddtechpubscomments@3com.com
Comments
Example
Requirements for
Hardware
Requirements
Hardware
Number Radios WX Switches 50+ WX Switches
Hardware Requirements for 3WXM Monitoring Service
Hardware Requirements for Running 3WXM Monitoring Service
Hard drive space Available Monitor resolution
Software
Installation
Preparing for
Installing 3WXM
If Autorun is disabled, follow these steps
Wizard
Using the Installation To use the installation wizard
Installing 3WXM
Installing 3WXM
OpenView Plug-In
Installing the HP To install the HP OpenView plug-in
Installing 3WXM
Click Get Activation Key
Installing 3WXM
Click Uninstall
Click Continue
Overview
Switches or monitor network data
Manager 3WXM interface
Working with the 3WXM User Interface
View Object Details or View Alerts from the main toolbar
Menu Options
Main 3WXM
Window
Menu Menu Option Description
3WXM Menu Options
To add a WX switch
Devices Apply Auto-Tune
Association failure rates
Open the 3Com 3WXM Administrator’s
Organizer Panel
Working with the 3WXM User Interface
Select an object Details are displayed here
Object
Settings for the following management services
Location Policy
Object Description
Working with the 3WXM User Interface
Mobility Domain Objects
WX Switch Objects
Ports/MAPs
Third Party AP Objects
Lists the object that can appear under Third Party APs
Alerts Panel
Content panel with more details
Alert Category Description
Lists the types of alerts displayed in the Alerts panel
Content panel displays information for objects selected
Content Panel
Toolbar option of the main 3WXM window
Monitor Tab Explore Window
Working with the 3WXM User Interface
„ Green Up
Monitor Tab Status Summary Window
Monitor Tab Client Monitor Window
Monitor Tab RF Monitor Window
Monitor Tab RF Trends Window
Working with the 3WXM User Interface
Resolutions Error/Warning Details
Working with the 3WXM User Interface
Content Panel
Information panel
Wizards
Configuration
Working with the 3WXM User Interface
Configuration Wizards
Reports
Reports
Pasting Objects
Copying
Replace
New switch appears under the Mobility Domain
Windows XP Only
Enabling Keyboard
Shortcut
Mnemonics
Enabling Keyboard Shortcut Mnemonics Windows XP Only
Working with the 3WXM User Interface
Managing network plans, and defining a Mobility Domain
Switch Manager 3WXM, restricting access to 3WXM, creating
Following steps describe how to start 3WXM
Starting 3WXM
Getting Started
To 3WXM
Restricting Access
Getting Started
Accounts
Monitor Accounts
Monitor accounts
To create a provision or monitor account
Managing Network
Creating
Plans
You must select a country code before continuing
Plan
Saving a Network Plan
Creating and Managing Network Plans
Saving a Network Plan with a New Name
Creating and Managing Network Plans
Getting Started
Plan
Getting Started
To override another user’s lock
Getting Started
Defining a Mobility Domain
Traffic Ports Used for AAA Servers and Management Servers
Domain
Protocol Port Function
Do one of the following „ To close the wizard, click Finish
Getting Started
Live network
Provide about your wireless coverage needs
Building Wizard
Network design information
Planning the 3COM Mobility System
Toolbar Options on Setup
Building Wizard Setup
OptionDescription
Building Wizard Edit Content
Lists the toolbar icons at the top of the floor display area
Toolbar Options on Edit Content
Building Wizard Plan RF Coverage
Toolbar Options on Plan RF Coverage
Building Wizard Optimize RF Coverage
Toolbar Options on Optimize RF Coverage
Toolbar Options on Report
Building Wizard Report
Campus
Creating a Site
Planning the 3COM Mobility System
Modifying Buildings in a Site
Creating or
Planning the 3COM Mobility System
Creating or Modifying Buildings in a Site
Drawing Floor
Importing or
Details
File Recommendations
To prepare a drawing before importing it into 3WXM
Preparing a Drawing Before Importing It
Importing or Drawing Floor Details
Planning the 3COM Mobility System
Common AutoCAD Layer Names
Useful AutoCAD Operations and Naming-Conventions
Importing the Drawing
Operating Tips
Click Import Floor Layout
Importing or Drawing Floor Details
To crop the paper space
Importing or Drawing Floor Details
Origin point
To adjust the origin point
New location of origin point
Hiding Layers
To adjust the scale
Adding or removing a layer
Moving an object from one layer to another
To clean up a drawing
Planning the 3COM Mobility System
Importing or Drawing Floor Details
Click Finish to save the changes and close the wizard
To draw an object
ObjectAction
Properties
Specifying the RF
Characteristics of a
Floor
To create RF obstacles for an area in a drawing
Go to To use the Create RF Obstacle Dialog box on
To create RF obstacles by grouping objects
To use the Create RF Obstacle Dialog box
ObjectAction
Planning the 3COM Mobility System
Coverage
To create a wiring closet
Shared Coverage Areas
Area
Drawing a Coverage Area
Coverage Area Choices wizard appears
Go to Specifying the Wireless Technology for a Coverage Area
Specifying the Wireless Technology for a Coverage Area
Specifying Coverage Area Properties
Planning the 3COM Mobility System
Specifying Association Information
Go to Specifying Association Information
Planning the 3COM Mobility System
Defining Wireless Coverage Areas
WX4400 switches support distributed MAP connections only
Setting Attributes for a Third-Party Access Point
Planning the 3COM Mobility System
Configuring Radio Attributes
Moving the AP Icon to its Floor Location
Computing MAP Placement
To specify design constraints
Computing MAP Placement
WX4400 switches support indirect MAP connections only
To compute and place MAP access points
To review coverage area computation
Go to To review coverage area computation
Computing MAP Placement
Planning the 3COM Mobility System
To unlock a coverage area
Locking and Unlocking Coverage Areas
To lock a MAP
Locking and Unlocking MAP Access Points
To assign channels
Planning the 3COM Mobility System
To compute optimal power
Planning the 3COM Mobility System
To resolve optimal power computation problems
Resolving coverage gaps
Verifying the Wireless Network
To place an RF measurement point
„ To list disabled access points, select Show Disabled MAPs
To use the RF interactive measurement mode
Signal strengths for any location on the floor
RF Measurement Information
Shows the information available in the RF measurement table
Value
Generating RF Network Design Information
Information
Reviewing Layout To see the floor layout, click View Layout
Click Generate Work Order
To generate a work order
Applying RF Auto-Tuning Settings to the Network Plan
Click Next. The progress is displayed Click Finish
Planning the 3COM Mobility System
Following figure shows an example of the wizard
WX Switch Wizard
„ AAA
WX Switch Wizard Overview
Settings, and so on. This page is shown above
WX Switch Wizard Overview
Configuring WX System and Administrative Parameters
WX Switch Wizard Overview
Network Plan
Switch to
Insert Wireless Switch
Adding a WX
See Adding a WX Switch to the Network Plan on
Accessing the WX
Switch Wizard
Configuration file
WX Properties
Configuring VLANs
Configuring WX System and Administrative Parameters
Roaming and VLANs
Vlan Names
Configuring Vlan Basic Properties
To configure Vlan basic properties
Adding Ports to a Vlan
Configuring Spanning Tree Protocol
Configuring WX System and Administrative Parameters
Configuring Spanning Tree Port Information
Configuring Igmp
„ To close the wizard and save the changes, click Finish
Configuring Static Multicast Ports
Configuring STP Fast Convergence Features
Configuring the MSS Dhcp Server
Select Spanning Tree Properties
Select Config Edit
Configuring WX Management Services
Setting System To set system information
Configuring WX System and Administrative Parameters
Configuring WX Management Services
Reenabling WebAAA
To configure Snmp Do one of the following
V1 or V2c Community String
Configuring an Snmp To configure an Snmp community string
V3 User
Configuring an Snmp To configure an SNMPv3 user
Configuring WX System and Administrative Parameters
Configuring a Notification Target
Configuring a Notification Profile
To configure a notification target Do one of the following
For SNMPv3, select the USM user
Setting Up System Logging
Configuring WX System and Administrative Parameters
To set up a syslog server
Setting Up a Syslog Server
Expand Management Services
Configuring Tracing
Deleting Traces
To delete a trace Organizer pane, expand the WX switch
To set summertime information
To set up a time zone
Configuring WX Management Services
Wired users is not encrypted after they are authenticated
Configuring Wired
Authentication
Wired authentication port is an Ethernet port that has
Other networking devices such as switches and routers
Configuring
Network Ports
WX1200 ports support full-duplex mode only
Configuring Load Sharing
Configuring IP Services
Creating Static Routes
To close the Create Static Route dialog box, click Finish
Configuring Default Routes
To create an IP alias Do one of the following
Creating IP Aliases
Setting Up DNS Basic Properties
Adding DNS Servers
Creating NTP Servers
Setting NTP Properties
Click New NTP Server
Adding ARP Entries
Configuring WX System and Administrative Parameters
Parameters
Configuring Wireless Parameters
RSN
Service Profile
Configuring a
Mycorp/mycorp-login.htm
Configuring WEP
Configuring To configure encryption, follow these steps
Encryption
Configuring a Service Profile
WPA and RSN Authentication Methods
Configuring WPA or RSN
WPA and RSN Cipher Suites
To configure WPA or RSN authentication
To configure WPA or RSN encryption choices
Profile
To map a service profile to a radio
Configuring Wireless Parameters
Configuring a Radio Profile
RF Auto-Tuning
Configuring a Radio Profile
To apply a radio profile to radios
Connected and Distributed MAPs combined
MAP Access Points
Configure a MAP port for each directly connected MAP
Directly Connected
Configuring Wireless Parameters
„ 112233445566778899aabbccddeeff00
Configuring Wireless Parameters
Transmit Power box, specify the transmit power for the radio
Configuring Wireless Parameters
Configuring Directly Connected MAP Access Points
Indirectly connected MAP
Access Points
WX Switch Model Maximum Maximum Booted Configured
Distributed MAP
Configuring Distributed MAP Access Points
„ 112233445566778899aabbccddeeff00
Configuring Distributed MAP Access Points
Configuring Wireless Parameters
Authorization ,
Server Groups
Connecting to
Overview on
To change default values for Radius parameters
To define a Radius server
Connecting to Radius Servers and Server Groups
To define a Radius server group
Changing the Order in a Radius Server Group
Managing Users
Local User
Database
You can create two types of users in the local database
To configure user authentication properties
Database
Click Choose Available
To configure user group authentication properties
Local database
To configure MAC address user authentication properties
Click Choose Available
To configure user authorization attributes
Start-date,end-date, or both
Authentication Attributes for Local Users
Attribute Description Valid Values Encryption-type
End-date
Attribute Description Valid Values Filter-id
Idle-timeout
Attribute Description Valid Values Mobility-profile
Ssid
Attribute Description Valid Values Session-timeout
Start-date
Url
Attribute Description Valid Values Time-of-day
Attribute Description Valid Values Vlan-name
User Globs
Accept user globs and MAC address globs
Vlan Globs
MAC Address Globs
To set the authentication method for administrator access
To set the accounting method for administrator access
Console Access Rules
Managing Administrator
Authentication
Configuring and Managing Access Rules for Network Users
MSS provides the following types of authentication
Authentication Types
Authentication Algorithm
To 802.1X? Yes
Last-Resort Processing
Ssid Name Any
User Credential Requirements
Page
Authentication To configure authentication rules
Page
To configure authentication settings
Page
Accounting
Page
Policy
To change the order of access rules
Location Policies
About the Location
To create a location policy rule
„ Ports
Configuring Location Policies
Click Close
To create a proxy authentication rule
Configuring AAA for Clients of Third-Party APs
To create a Radius proxy client entry
To configure a port as a Radius proxy for an Ssid
To create a Mobility Profile
Mobility Profiles
Included, or you can specify a list of ports to be included
Attribute VSA
Security
Using Access
Creating Access
Control Lists for
Go to Defining Access Control Entries
Setting Up ACL Basic Properties
Defining Access Control Entries
Creating an IP ACE
Page
Creating a TCP or UDP ACE
To define the action of the ACE
Creating an Icmp ACE
Type box, specify the Icmp type used to filter Icmp packets
Icmp Message Type Number Code Number
Icmp Messages and Codes
Commonly Used IP Protocol Numbers
Creating a Layer 4 Protocol ACE
IP Protocol Number
To add ACEs to an ACL and organize them
For a complete list of IP protocol numbers, see Click Finish
Mapping User-Based ACLs
Mapping an ACL to a Vlan
Mapping ACLs to Ports, VLANs, or Virtual Ports
Mapping an ACL to a Distributed MAP
ACL Map page, click New
Mapping an ACL to a Virtual Port
Mapping an ACL to a Port
Configuring 802.1X Parameters
Attempts
Click Finish
Page
WX File Management Options in 3WXM
Chapter where the options are described
Managing WX
System Files
Network on
Uploading a WX
Switch
Configuration into
Not defined in 3WXM, uploading the WX configuration creates
To upload a WX switch configuration
Verifying
Refresh Refreshes the data Options
Toolbar Options on Verification Tab
To resolve an error or warning
Select the warning or error message
To disable a specific instance of a warning or error
To globally disable a warning or error
To change verification options
To disable or reenable a rule
Or for specific instances
Managing WX System Images and Configurations
Changes
Network
Toolbar Options on Managed Devices Tab
Changes To review changes
Click Deploy Now
To deploy local changes
To accept network changes
Nonmatching
To undo changes
Options Alerts panel
To modify configuration polling options
Deploying WX
Switches from a
Network Plan to
Files
Distributing Image
Click Distribute
To distribute a system image
Select Distribute Config Click Distribute
Importing Exporting WX switch Configuration Files
Distributing WX Configuration Files
To distribute a WX configuration file
Importing and Exporting WX switch Configuration Files
Managing WX System Images and Configurations
How Changes Are
Applying Policies
Managed
Configuration Information
Configuring a Policy
For This Feature Area See
Configuration Information
Reviewing Applying Policy Settings
Switches or MAP Access Points
Rebooting WX
Click Review Changes
Distributing PKS #12 files
„ 802.1X-EAP certificate for a WX switch
„ WebAAA certificate for a WX switch
When 3WXM connects to 3WXM Services or a WX switch,
Certificates
Processing
To process a certificate
Select Tools Certificate Management
Managing
Certificate that is stored in the 3WXM certificate store
To review certificate details
Managing Certificates
Statistics and the event log
Switches and shows information based on those traps
Monitoring
Accessing
To access monitored data
Requirements for
Using the Explore Window
„ Green Up
IconDescription
Toolbar Options in Link View of Explore Window
Toolbar Options in Floor View of Explore Window
Lists the options on the toolbar in the floor view
Toolbar Options in Floor View of Explore Window
Monitoring the Network
Using the Explore Window
Monitoring the Network
Display Option
Coverage Display Options in Explore Window
To take an RF measurement
3Com radio on the floor
RF measurement point Rssi measurements
Summary Window
Using the Status
Status Summary window shows the operational status of 3Com
Toolbar Options in Client Monitor Window
Using the Client
Monitor Window
Activity on the network
To refresh the data automatically
To refresh the data on demand
Client Activity Columns When a Mobility Domain is Selected
Data Displayed When a Mobility Domain or Site is Selected
Number of times authentication for a client failed
Client Activity Columns When a Mobility Domain is Selected
Data Displayed When a Switch, MAP, or Radio is Selected
Ssid
Activity Details for Association Failure
Activity Details for Authentication Failure
Column Description
Peap
Activity Details for Authorization Failure
ColumnDescription
Activity Details for Authorization Successful
DOT1X
Activity Details for Disassociation
Activity Details for Client Cleared
Activity Details for Dot1x Failure
Activity Details for Roam
Data Displayed When a Mobility Domain is Selected
Client Sessions Columns When a Mobility Domain is Selected
Client Sessions Columns When Scope Is a Mobility Domain
Data Displayed When the Scope is a Mobility Domain
Data Displayed When a WX Switch, MAP, or Radio is Selected
Session Properties Columns
Displaying Session Details
Authentication Server
New location
Session Statistics Columns
Session Statistics Columns
Location History Columns
Adding a Client to the Watch List
Clients on the watch list by MAC address
„ natasha@example.com
Using the Client Monitor Window
Displaying the Client Watch List
Removing a Client from the Watch List
Details are displayed on the following tabs
Terminating a Client’s To terminate a client’s session
Displaying a Client’s Geographical Location
Session
Ssid the radio can hear
Using the RF
„ RF Neighborhood lists the other transmitting devices that
Radio can hear
Window
Displaying RF
Window
Mapping
RF Monitor RF Neighborhood Columns
RF Monitor Activity Log Columns
RF Monitor Environment Columns
Statistics
Can indicate interference from a non-802.11 device
As cordless phones and webcams, appear to generate
RF Trends Columns
Statistics
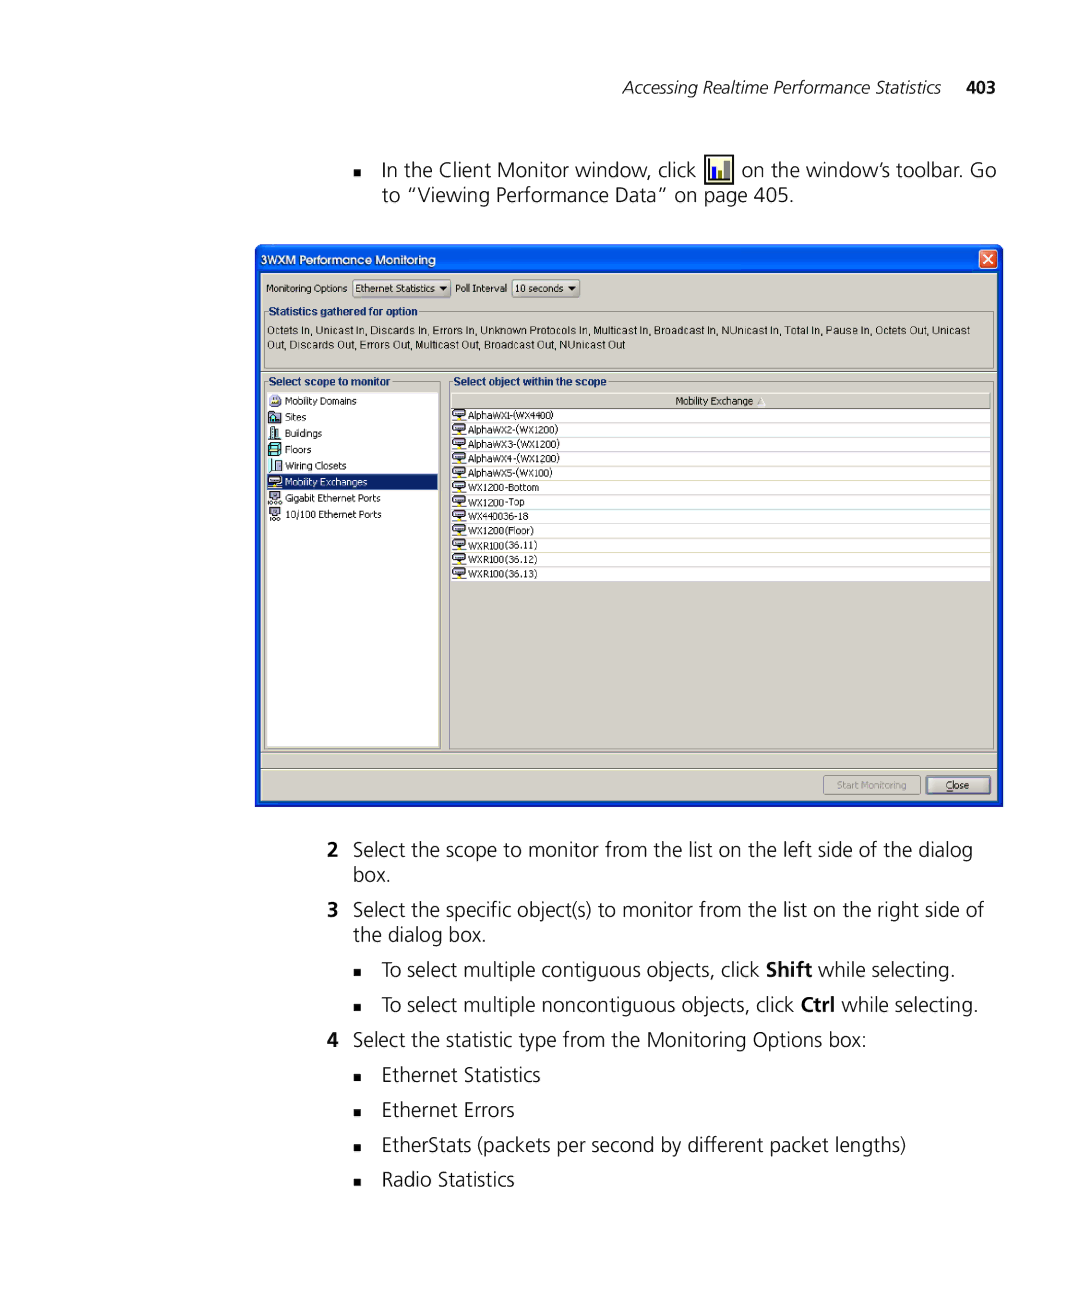
To access performance statistics from the network
Accessing Realtime Performance Statistics
Monitoring the Network
Accessing Realtime Performance Statistics
Viewing Current Data
„ Octets In/Out „ Packets In/Out „ Errors In/Out
Viewing Historical Data
Viewing Data in Percentages
Accessing Realtime Performance Statistics
To export data to a file
Exporting Performance Data
Event log
Accessing the Event
Log
Displaying
Toolbar Options on Event Tab
Using Predefined Event Filters
To filter messages by content
Filtering Events by Content
Monitoring the Network
Filtering Events by Facility
Filtering Events by Severity
Saving Filters
Exporting Filtered Data
Deleting Filters
Accessing the Event Log
Monitoring the Network
Users
Dynamic Frequency Selection DFS
Both enabled radios and disabled radios perform these scans
Snmp Notifications for RF Detection
Rogue Detection Requirements
Notification Type Description
Other than an associate request flood
Rogue Detection Lists
Detecting and Combatting Rogue Devices
Using the Rogue Detection Tab
Toolbar Options on Rogue Detection Tab
To filter the rogue list
Using the Rogue Detection Tab
Current, Current Hour, Current Day, and History Tabs
To change the scope of the rogue list
Rogue Listener Details Columns
Activity Log Tab
Listeners Tab
Rogue Details Columns
Location
Displaying a
Rogue’s
Geographical
They are present on the network
Adding a Device to
Attack List
To add a device to the ignore list
Into a Third Party
Converting a Rogue
List
Configuring RF
Adding a Rogue’s
Clients to the Black
Type the SSID. c Click Finish
Click Permitted OUI List
Configuring RF Detection Options from the Organizer Panel
Detecting and Combatting Rogue Devices
Generating Reports
Site Survey
Work orders
Click Generate
Generating an
Inventory Report
To generate an inventory report
Mobility Domain
Switches
Mobility Domain Configuration Report dialog box appears
Generating a
WX Configuration Report Sections
Configuration Report
Summary Report
Details Report
Click Generate
Errors Report
Click Generate
Network usage report lists network usage statistics
Generating a Network Usage Report
Summary Report
Scope is always MAP Radio and cannot be changed
Details Report
Generating a Rogue Summary Report
Click Generate
Click View Work Order
Generating Reports
Importing Measurements
Importing RF
Measurements
RF obstacle data
Optimizing a Network Plan
Map name must match the name used in the site survey tool
Applying the RF Measurements to Floor Plan
Locating a Coverage Hole
Locating and Fixing
Coverage Holes
Coverage holes by displaying coverage
Optimizing a Network Plan
Installed to Network Plan
Optimizing a Network Plan
To start 3WXM from Network Node Manager
Preparing to Use HP OpenView and 3WXM
From Network Node
Manager
Chapter a Using 3WXM with HP Openview
To change 3WXM preferences, in the main 3WXM window, select
Change options for network synchronization, user interface
Logging
That system
Synchronization
Resetting
Preferences Values
Changing Network
Changing Network Synchronization Options
Within Window Style, select one of the following
Changing User Interface Options
„ Multiple Show the topology in multiple windows
Changing Tools
Click the Certificate Handling tab
Changing
Certificate
Check on
You can change the following RF planning options
Typical Client’s Transmit Power
Changing Options
For RF Planning
Chapter B Changing 3WXM Preferences
To Change a Color
Defining a Color from the Palette
Defining a Color by Changing HSB Properties
Defining a Color by Changing RGB Properties
Changing 3WXM Logging Options
Chapter B Changing 3WXM Preferences
Preferences
Chapter C Changing 3WXM Services Preferences
Stopping
3WXM Services
Services
Starting or
To connect to 3WXM Services
Connecting to 3WXM Services
Verify that the service is running on the server
Chapter C Changing 3WXM Services Preferences
Verifying that
Receiving Service
Changing Service
Settings
Chapter C Changing 3WXM Services Preferences
Changing WX
WX connection settings control the timeout and retries for
Service will accept from the WX switches
Click the WXs Connection Settings tab
Chapter C Changing 3WXM Services Preferences
Windows. lists the source of the data for each window
Monitor tab and for the Performance Statistics window
Sources of Monitor Data
Polling Interval is 5 minutes and cannot be changed
Click the Monitoring Settings tab
Changing Monitoring Settings
Https//ip-addr
Managing Network Plans
Chapter C Changing 3WXM Services Preferences
Backup
Chapter C Changing 3WXM Services Preferences
Value-Added
Register Your
Product
Purchase
Technical Support
Access Software
Downloads
Telephone
Contact Us
Latin America Telephone Technical Support and Repair
Country Telephone Number
US and Canada Telephone Technical Support and Repair
Index
Index
User privileges Configuring
SSH
Index
Index