Using MCI Monitor Mode
The SID provides an MCI data link monitor that allows you to view transactions sent between the switch and the SID. This view is similar in format to the SMDI Monitor. The top line on the display shows message waiting commands and the bottom line shows calling party data. Use the following instructions to use the MCI monitor view:
1.Access the View menu as described in the previous section.
2.Press MODE .
3.Press 2 to select the MCI option. You see the following screen.
MCI .0!B230100000001.
The display updates as packets are transmitted and received on the MCI data link. You see the Idle message and the Integration Stopped message under the same circumstances as in the SMDI monitor mode.
Using Statistics Mode
Use the following instructions to use the Statistics monitor mode.
1.Access the View menu as described in the previous section.
2.Press MODE .
3. Press 3 | to select the Statistics | option. You see the following screen. | |||
|
|
|
|
|
|
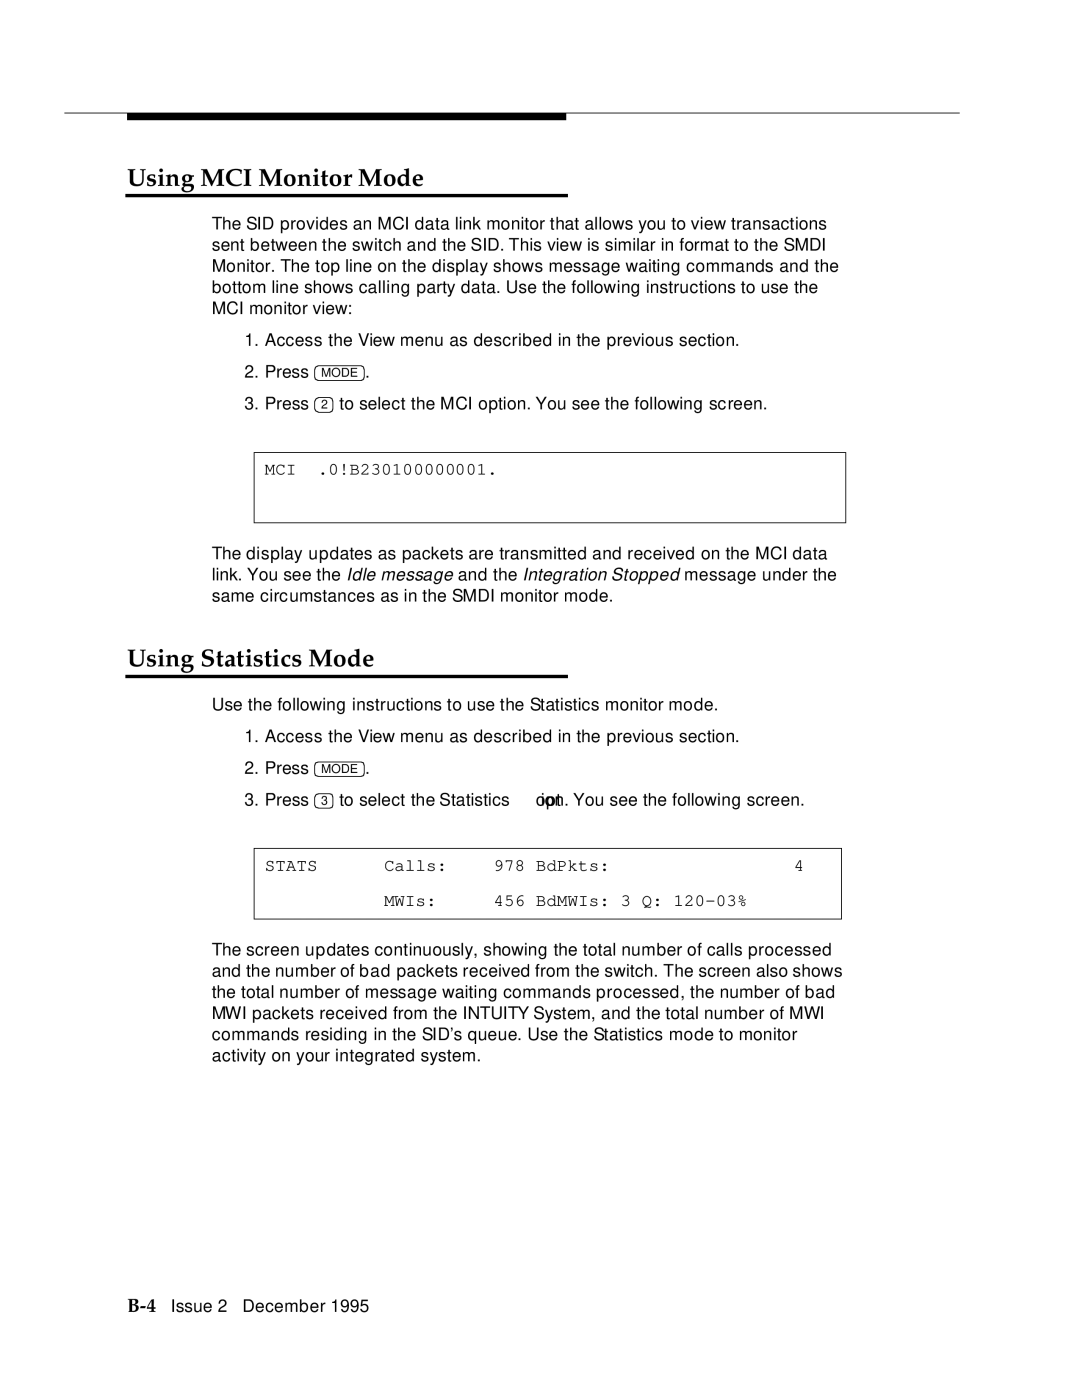
| STATS | Calls: | 978 | BdPkts: | 4 |
|
| MWIs: | 456 | BdMWIs: | 3 Q: |
|
|
|
|
|
|
The screen updates continuously, showing the total number of calls processed and the number of bad packets received from the switch. The screen also shows the total number of message waiting commands processed, the number of bad MWI packets received from the INTUITY System, and the total number of MWI commands residing in the SID’s queue. Use the Statistics mode to monitor activity on your integrated system.