High availability | Managing an HA cluster |
|
|
3Select Sessions & Network.
The cluster displays sessions and network status for each cluster member. The primary unit is identified as Local and the other units in the cluster are listed by serial number.
The display includes bar graphs of the current number of sessions and current network utilization as well as line graphs of session and network utilization usage for the last minute. The line graph scales are shown in the upper left corner of the graph. For more information, see “Viewing sessions and network status” on page 112.
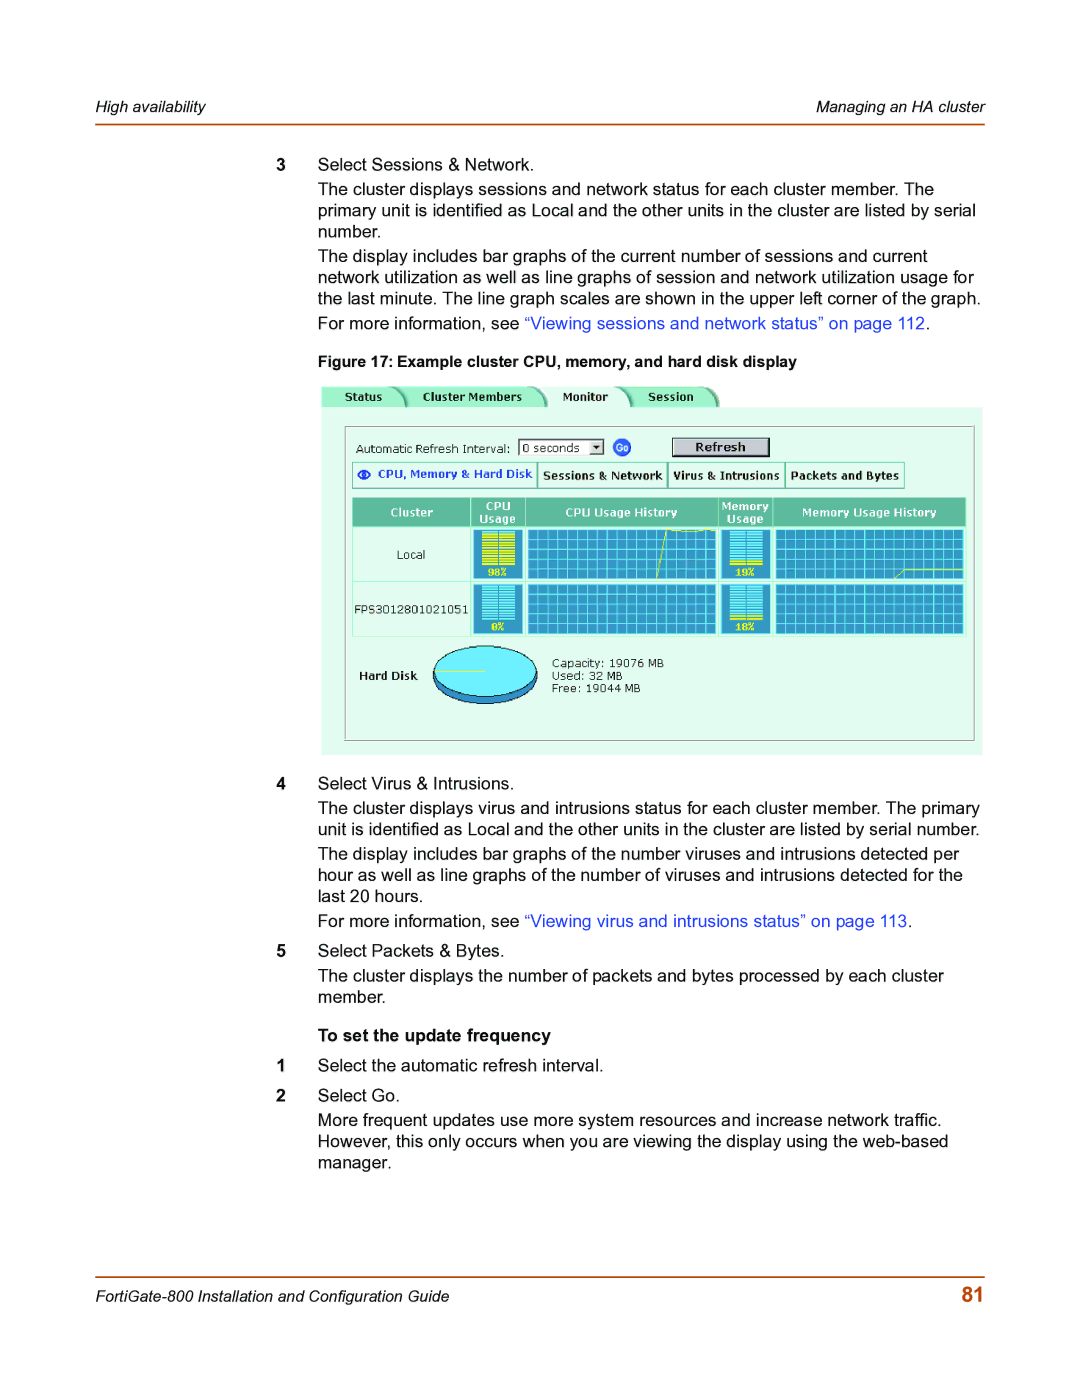
Figure 17: Example cluster CPU, memory, and hard disk display
4Select Virus & Intrusions.
The cluster displays virus and intrusions status for each cluster member. The primary unit is identified as Local and the other units in the cluster are listed by serial number.
The display includes bar graphs of the number viruses and intrusions detected per hour as well as line graphs of the number of viruses and intrusions detected for the last 20 hours.
For more information, see “Viewing virus and intrusions status” on page 113.
5Select Packets & Bytes.
The cluster displays the number of packets and bytes processed by each cluster member.
To set the update frequency
1Select the automatic refresh interval.
2Select Go.
More frequent updates use more system resources and increase network traffic. However, this only occurs when you are viewing the display using the
81 |