Cat. No. V022-E3-1
NT-seriesProgrammable Terminal
Operation Manual
Page
•OMRON,1997
OMRON Product References
Visual Aids
Page
5, #
TABLE OF CONTENTS
SECTION
SECTION
SECTION
APPENDICES
INDEX
SECTION
About this Manual
Manuals
Creatingand Transferring Screen Data
?%%%##+#PRECAUTIONS
1 Intended Audience
2 General Precautions
3 Safety Precautions
Safety Precautions continued
Safety Precautions continued
Severe temperature variations
Safety Precautions continued
tion
Page
SECTION Functions of the NT600S
Alarm
Role and Operation of NT600S
Section
Production Line Status
Section
2-1-1
Operations of NT600S
Displays Screens
2-2-1
Features
Functions of NT600S
Section
Section
Functions Related to the Data Display
2-2-2Principal Functions of NT600S
Section
Functions Related to the Data Input
Section
Comparison between NT600S and NT600M
2-2-3
Section
put notification
Section
2-2-5Displays
Touch Switches
Characters text
Section
2-3System Configuration
When using the Host Link/NT Link 1:1 Function
C200HX/HG/HE OMRON PC
Section
Reference NT Link 1:N Systems
NT600S
Type NT-LB122 Support tool
I/O connecting cable C200H interface unit
Section
Personal computer IBM PC/AT or compatible
Function
2-4Direct Connection Function
Section
Section
2-4-1What is the NT Link 1:N
Features of the NT Link
Reference
Advantage of C200H Direct Communication
2-4-2C200H Direct Communication
Section
Functions of Display Elements
2-5Functions of the Allocated Bits and Words
Section
Touch switches Allocation destination: Bit
Section
Example of the PT status notify area application
Section
Example of the PT status control area application
Terminal commands
2-6Communications by RS-232C
Operation commands
Section
Section
2-7Before Operating
When using Host Link/NT Link/RS-232C
Reference
Section
Equipment or Software
Page
SECTION Hardware Settings and Connections
Section
3-1Description of Parts and Settings
3-1-1Description of Parts
Front View
NT600S-ST121-EV NT600S-ST121B-EV
Section
Rear View
Reference
3-1-2DIP Switch Settings
Section
Section
3-2Installation
3-2-1Installation to the Operation Panel
3-2-2Power Supply Connection
Section
3-2-3Grounding
Section
3-3Connecting to the Support Tool
Section
3-4-1
3-4Connection to a PC by the Host Link
Compatible PCs
Section
Section
3-4-2Connecting the NT600S
Connecting to a PC with a 25-pinConnector
Connecting the NT600S to a C Series CQM1 Unit
$& Section
Connecting to a PC with a 9-pinConnector
Connecting to C Series C200HX/HG/HE
When Long-DistanceTransmission is Required
3-4-3PC Switch Settings
Connecting to C Series CPM1
Section
Setting the rear switches
Connecting to a Host Link Unit
Setting the front switches
Setting the front switches
Section
Setting the rear switches
I/O port selection selector switch
C500/C1000H rack-mountingtype: C500-LK203
Setting the rear switches
Section
CPU-mountedtype: C120-LK201-V1
Setting the rear switches
Section
Section
Setting the front switches
Unit # SW3 and SW4 Set these switches to “0”
Section
Connecting to a CPU
Setting the frontswitches
Switchsettings CPM1
Making the PC system settings
Switch settings C200HS,C200HX/HG/HE, CQM1
PC system setting area settings
When using CPM1
When using port A of C200HX/HG/HE
When using port B of C200HX/HG/HE
Section
Section
3-5Connection to a PC by the NT Link 1:1
3-5-1Compatible PCs
Section
3-5-2Connecting the NT600S
When Long-DistanceTransmission is Required
If a Cable Longer Than 5 m is Required
Section
3-5-3PC Switch Settings
Switch setting C200HS,C200HX/HG/HE, CQM1
Section
3-6-1Compatible PCs
3-6-2Connecting the NT600S Units
3-6Connection to a PC by the NT Link 1:N
Section
Connection Diagram
Section
Converter Unit Connector Specifications
Section
RS-422Aconnection
Wiring Method
Section
RS-422ACable Wiring ➁
RS-232CCable Wiring NT600S-ST121B-EV
RS-422ACable Wiring ➀
Section
RS-485connection
RS-232CCable Wiring
Section
NT-AL001to NT-AL001
RS-422Aconnection, RS-232Cat the PC side
NT-AL001Converter Unit DIP Switch Settings
Section
RS-485connection, RS-232Cat the PC side
RS-485connection, RS-485at the PC side
Section
RS-422Aconnection, RS-422Aat the PC side
NT600SNT600SNT600S
3-6-3PC Switch Settings
Section
3-7-1Compatible PCs
Section
C200H Interface Unit Part Names and Functions
Mounting and Setting the C200H Interface Unit
Section
Mounting the Unit to the NT600S
Removing the unit
C200H Interface Unit Switch Settings
Section
out while keeping a firm grip
Section
3-7-2Connection Method
I/O connecting cable
CPU unit
Section
Connection to a C200H/C200HS, C200HX/HG/HE
I/O connection cable
Section
Only one CPU unit can be connected
Switch the power OFF in the following way
Power ON
Power OFF
Section
3-8Host Connections by RS-232C
3-8-1Host Computer Communication Settings
3-8-2Connector Pin Arrangement
Section
Connecting to the Host Computer
Section
SECTION System Menu Operation
System Maintenance page
4-1Operation Flow by the System Menu
Memory Switch Setting page
Section
Procedure
4-2-1Changing the System Settings etc
4-2Starting the NT600S
Section
Section
4-3Operation Modes and the System Menu
4-3-1System Menu and the Operation Modes
Section
4-3-2Menu Tree
SYSTEM MENU Quit Transmit Mode Maintenance mode
4-3-3Operations with the System Menu
Section
PT Setting Status
SYSTEM MENU Quit Transmit Mode Maintenance Mode
MAINTENANCE MENU
Memory Switches
Section
4-4Initializing Memory
4-4-1Initialization of the Screen Data
Section
SYSTEM MENU Quit
Section
Memory Switches
Initialize the Screen Data Memory? Confirm Cancel
MEMORY INITIALIZATION MENU Quit
Section
SYSTEM MENU Quit
PT Setting Status
Initialize the Memory Tables? Confirm Cancel
MAINTENANCE MENU
Memory Switches
Initialization of the Memory Switch
Memory Switches
Initialize the Display History? Confirm Cancel
Section
Section
SYSTEM MENU Quit
Transmission --Transmission in File Units
4-5Registering the Screen Data
Section
Reference
Section
Transmission in Screen Units
Support tool
TRANSMIT MODE
Section
SYSTEM MENU Quit
EXIT
Section
Setting Functions and the Memory Switch Menu
MEMORY SWITCH MENU 1/2
Memory Switches
EXIT
Automatic Reset
Selecting the Host Communication Method
4-6-1
4-6-2Baud Rate Selection Host Link Only
4-6-3Setting Unit Numbers NT Link 1:N Only
MAINTENANCE MENU
Section
Setting the RS-232CCommunication Conditions
4-6-4
4-6-5Selecting the Automatic Reset Function
Select “Memory Switches”
4-7Starting the Operation
Section
Section
4-8Various System Settings
4-8-1Setting the Key Press Sound
Setting the Buzzer
Using the Buzzer
4-8-2
Section
EXIT
Setting the Buzzer
Section
NEXT
4-8-3Backlight OFF / EL Screen OFF Function
Section
Select “Memory Switches”
Section
Section
Menu shown below
4-8-5Setting the Support Tool Mode
Section
Section
Support Tool Mode
Section
4-9System Maintenance
4-9-1I/O Check
SYSTEM MENU Quit Transmit Mode Maintenance Mode
Section
Transmit Mode Maintenance Mode
Section
Checking the Backlight NT600S-ST121Only
Section
Checking the LCD/EL display
Section
SYSTEM MENU Quit
Section
SYSTEM MENU Quit
4-9-2Checking the NT600S DIP Switch Settings
Section
Section
4-9-3Checking the PT Setting Status
Checking the PT setting Status
MAINTENANCE MENU
Section
4-9-4Display History
Section
Section
SYSTEM MENU Quit
Section
Display in time order
SECTION NT600S Functions
5-1Creating and Transmitting Screen Data
Section
Section
5-1-2Creating Screen Data
Screen Data Creation Procedure
Section
Select “Edit Screen”
Section
Select a screen number and press Enter
Section
Transmitting Screen Data to the NT600S
Section
5-2Outline of Functions
5-2-1NT600S Screen
Screen Management
Section
Types and Attributes of Characters and Figures
Types and Attributes of the Figures
Section
Reference Smoothing
Section
5-2-3Communication with the Host
Communication Using RS-232C
Controllable NT600S Functions
Section
Ascertainable NT600S Statuses
Section
5-3Screen Display
5-3-1Classification of Screens
Normal Screen
Example continuous screens
Section
Continuous Screens
Section
5-3-2Screen Attributes
Numeral Setting Attribute
Production Status
Backlight attributes NT600S-ST121only
Section
Bit input attributes RS-232Ccommunication only
Section
5-4Memory Tables
5-4-1 Character-StringMemory Table
Displaying a Character-string
Displaying a Numeral
5-4-2Numeral Memory Table
Section
Section
Numerals Which can be Displayed
Section
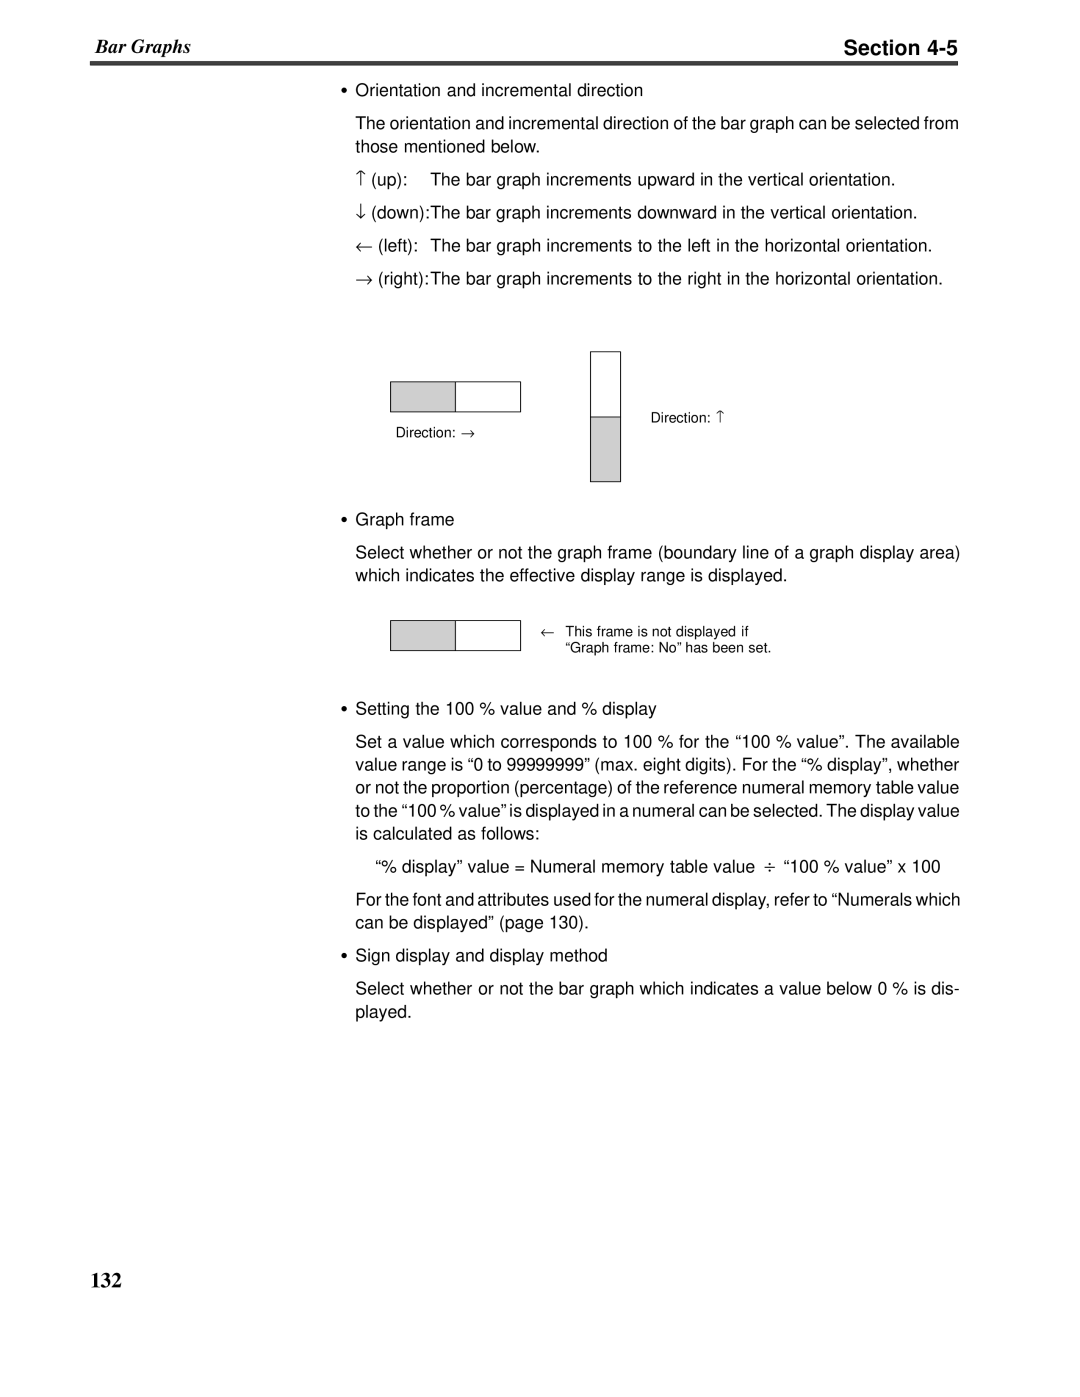
5-5Bar Graphs
5-5-1Bar Graph Functions
Bar Graph Attributes
Page
Section
To display a value below 0 % Sign display “Yes”
When the frame is displayed
Section
Section
5-6Lamps
5-6-1Lamp Functions
Lamp Attributes
Section
Controlling lamps in a batch
OMRON
Section
OMRON
Correct use
5-7Touch Switches
Section
Reference
5-7-1Functions of Touch Switches
Section
Functions of touch switches
Section
5-7-2Standalone Function
Section
Allocation of System Key Functions
5-7-3System Key Functions
Section
Section
5-8Numeral Setting
5-8-1Function of Numeral Keys
5-8-2Types of Numeral Setting
Section
Section
Thumbwheel Type Ver.5 Direct Connection Only
5-8-3Creating Numeric Keys
Section
Section
Continuous screens and overlapping screens
Section
5-8-4Using Numeric Keys
Selecting the Numeral Setting Area for Data Input
numeric values including a decimal point
Section
5-8-5Using Thumb Wheel Keys
Only When Direct Connection Ver.5 is Specified
Section
Upper/lower limit check
Page
SECTION Using Host Link/NT Link/C200H Direct
6-1-1
Equipment and Settings Used in This Chapter
Allocatable Bits and Words
6-1-2
Section
6-1-3NT600S Status Control and Notification to PC
&00&
NT600S operation
&00& Section
NT600S operation
Section
Reference
NT600S operation example
&00& Section
Reference Reference
Reference
&00&
Section
PT status notify bits 15 14 13 12 11 10 9 8 Bit
6-1-4Switching the Screen Display
Section
Example of Display Screen Switching
Section
Section
6-1-5Notifying the Display Screen to the PC
&00&
&00& Section
PT status notify area: Word
Writing Words to the Character-StringMemory Table
6-2Memory Tables and Bar Graph
Section
Direct specification
Section
Section
Writing Numerals to the Numeral Memory Table
Setting the Words of the Numeral Memory Table
Section
Available allocation words
Contents of the numeral memory tables
Section
Stored as a single word
Section
Numeral memory table display examples
Character-stringmemory table display example
Example of character code bestriding words
3 Section
Section
PC ladder program
Section
1 is explained
Line
NT600S
Section
Reference
6-2-4Copying the Memory Table
Section
Memory Map page
Section
Available allocation words
Use “table edit”
Normal
Section
Section
PC ladder program
Section
Changing the Contents of Allocated Words
6-2-5Upgrading Bar Graphs
Reference Reference
Section
6-3Lamps, Touch Switches, and Numeral Setting
6-3-1Allocation Bits and Display of Lamps
Example of batch lighting
Procedure
Section
Process
Section
Line
Conveyor Loading Robot Arm
Section
Method for PC Notification and NT600S Control
Section
Notes on the Notification Operation
Section
6-3-4Lit Flashing and Unlit Touch Switch Statuses
Changing the Status of Allocated Bits
Section
Momentary : 0 OFF ... Not pressed 1 ON ... Pressed
Section
Application
RUN STOP
Section
6-3-6Notification of Numbers to the PC
Section
Section
Restrictions on allocating words
unit
Section
Line
unit
Section
6-4NT600S Status Control
6-4-1Controllable NT600S Functions
Section
Connection to RS-232Cport of C200HX/HG/HE
buzzer stop attribute function is allocated
Section
Reference Reference
Section
6-4-2How to Control NT600S Functions
Procedure
Application
Section
PC program Create the following PC ladder program
Section
6-5-2Reading the NT600S Operating Statuses
Section
Example of Using the PT Status Notify Bit
Section
Section
Program operation
SECTION Using the RS-232CInterface Unit
Section
7-1-1Communication Procedure
7-1 RS-232CInterface Unit Communications
OPEN
Operation by Terminal Commands
#%1 Section
Operation by Operating Commands
Message from Host to NT600S
Interval Between Transmitted Commands
7-1-2Precautions
Command Length
Controlling PT Status with Operating Commands
7-1-3Notification and Control of Touch Switches
Section
Operating Commands
Table of Commands
7-1-4
Terminal Commands
Delete
Display Specified Screen
7-2Commands Sent by the Host
7-2-1Displaying the Screen
Switching the Display Screen
Write Character-stringMemory Table
7-2-2Memory Tables
Request Screen Number
Section
Section
4-digitWrite Numeral Memory Table
8-digitWrite Numeral Memory Table
Writing Numerals
Format
Copy Memory Table
Section
Description
Section
7-2-3Lamps and Touch Switches
Lamp and Touch Switch Display Bit Specification
Format
Section
Lamp and Touch Switch Display Status Enquiry
Bit OFF: The lamp or touch switch is turned off
Example
Disabling/Enabling the Touch Switch Input
Touch Switch Disable
Touch Switch Enable
Section
Buzzer Control
7-2-4Controlling the NT600S Status
Screen Display Control
Section
Initialize Display History
System Menu Display Permission
PT Status Enquiry
Enquiry of the Battery Voltage Status
Format
Display Mode Control
Section
Description
7-3-2Memory Table
7-3Commands Sent by the NT600S
7-3-1Screen Display
Screen Number Response
8-digitNumber Input Notify
7-3-3Lamps and Touch Switches
Lamp and Touch Switch Display Status Response
ported to the Host with this command
Section
Touch Switch Bit Output from NT600S to Host
Notifying that a Touch Switch Has Been Pressed
Format
Notifying Low Battery Voltage
Touch Switch Number Output from NT600S to Host
PT Battery Status Response
Section
7-4-2Displaying a Character-String
7-4Terminal Commands
7-4-1Clearing the Screen
Clear Screen
Canceling the Inverse/Flashing Display
Specify Character Enlargement
Normal Display
Section
Set Flashing Display
Set Inverse Display
End Inverse Display
Canceling the Inverse Display
Reference Canceling the Flash Display
End Flashing Display
Set Cursor Position
Section
Draw Polyline
7-4-3Displaying Figures
Specify Displayed Characters
Section
Displaying the Circle
Draw Circle
Section
Format
Section
7-5Key to Programs
7-5-1Use of Programs
+01@
67.$6$3
Section
##############################23456782249
%#L?#?+/%11
1###1
D!4244D
1?1N+
1-.1>
Page
249H+
CI+1E
0&/RJ
JK1/1
JK11JK11.M
B!684965D671
JK11
######################################4I645C2
JK11+
JK11
JK11
2D5IUU1
684934567
54!745673
D634567
4B34567
Page
Page
54!78
54!7
921<=1
54!74U
=4$=##!$%0=4&4%46&%
?55.+
8-1Hardware Faults
Section
Section
Errors Occurring During Operation
Responding to Displayed Error Messages
Errors Occurring when the Power is Turned ON
8-2-1
Section
8-2-4Communication Errors
Screen when an error has occurred during sending
Overrun Error
Section
Spare PT
8-3Maintenance of the NT600S
Section
Backlight
Screw securing CFL case lid CFL case lid
Section
Replacing the Backlight
Section
3.Remove the backlight
Operation
Replacing the Battery
Section
ips head screwdriver, then open the CFL case lid
3.Pull out the battery together with the connector
Section
Section
Inspection and Cleaning
Cleaning Method
Inspection Method
Section
Cautions on replacing the NT600S
Page
APPENDIX A
Specifications
General Specifications
Appendix A
Panel Specifications
Performance Specifications
Display Specifications
Appendix A
Display Capacity
Display Element Specifications
Appendix A
Number of numeral memory tables that can be used
Special Features
Appendix A
For a Host Link
Communications Specifications
Appendix A
For an NT Link 1:1
Appendix B
Dimensions
APPENDIX B
POWER RUN
Appendix B
Installation
Cable Installation
Unit : mm inch
APPENDIX C
Installation and Removal
&!#0!891
Handling the RS-232C/RS-422Converter Unit
&!#0!891
Installation on a DIN Rail
Installation in an Operation Panel
Appendix C
Appendix D
NT600S Installation Environment
APPENDIX D
Note on transportation
Transportation and Storage of the PT
Appendix D
Note on storage
Appendix E
APPENDIX E
Making the Cable for Connection to the PC
Parts Required
Correct Use
NT600S Connector Specifications 9-pin
Appendix E
an NT600S to a C-SeriesHost Link
2. C500-LK201and C200H-LK201-V1only
Wiring Connections
Appendix E
Communication Port 2 9-pinConnector
$0& Appendix E
Communication Port 1 25-pinConnector
an NT600S to a CVM1/CV-SeriesHost Link Unit
Communication Port 2 9-pinConnector
Wiring Connections
Communication Port 1 25-pinConnector
Appendix E
Appendix E
Applicable CPU
Appendix E
previous to 15Y5 cannot be connected
Appendix E
NT-AL001 RS-422Aterminal block specifications
Wiring
For NT600S-ST211B-V
Cable Preparation
Making the Cable
Appendix E
Appendix E
Soldering
Appendix E
Preparing RS-232CConnector Cables
Connector Cover Assembly
Recommended Parts
#0!891*+
Connecting to an RS-232C/RS-422Converter Unit 1:1
APPENDIX F
Appendix F
Appendix F
#0!891*+
RS-422ACable Wiring
APPENDIX G
Appendix G
Parts Required
Wiring Connections
APPENDIX H
Appendix H
With a 9-pinConnector
Appendix H
NT600S Internal Processing
Periodic Processing When Using Direct Connection
APPENDIX
Appendix
Appendix
NT600S processing
Event Processing When Using Direct Connection
Appendix
Details of processing
Model List
APPENDIX J
Host Link Unit
Appendix J
CPUs For Connection Via a Host Link
Appendix J
Appendix J
CPUs For Connection Via an NT Link 1:1
CPUs For Connection Via an NT Link 1:N
RS-232CAdapter
Related Parts and Equipment for PT
RS-232C/RS-422Converter Unit
Appendix J
Applicable connectors
Parts Used for Connection
Cables with connectors
Appendix J
Appendix K
APPENDIX K
Option List
Replaceable Backlight ... NT600S-CFL01
Appendix K
Chemical-resistantCover .. Type NT600S-KBA01
Appendix K
Battery ... 3G2A9-BAT08
This is a lithium battery used for memory backup
C200H Interface Unit ... NT-LB122
OMRON CV-SeriesMemory Map
APPENDIX L
OMRON C-SeriesMemory Map
PC Memory Map
Appendix M
APPENDIX M
Special Characters English Character Codes
Hex Digits
Appendix M
1: Used as the prefix for mark data codes 2 bytes
Page
INDEX
Initialization by using the DIP switch
Initialization of the display history data
Memory initialization by using the DIP
Lamp and touch switch display status
Lamp and touch switch display status
Set a system key function for a touch
Touch switches used to call the system
Use touch switches for notification to the
Page
Operation Manual
NT-series Programmable Terminal
Revision History