CHART MANAGER UTILITY
Displaying Graphic Charts
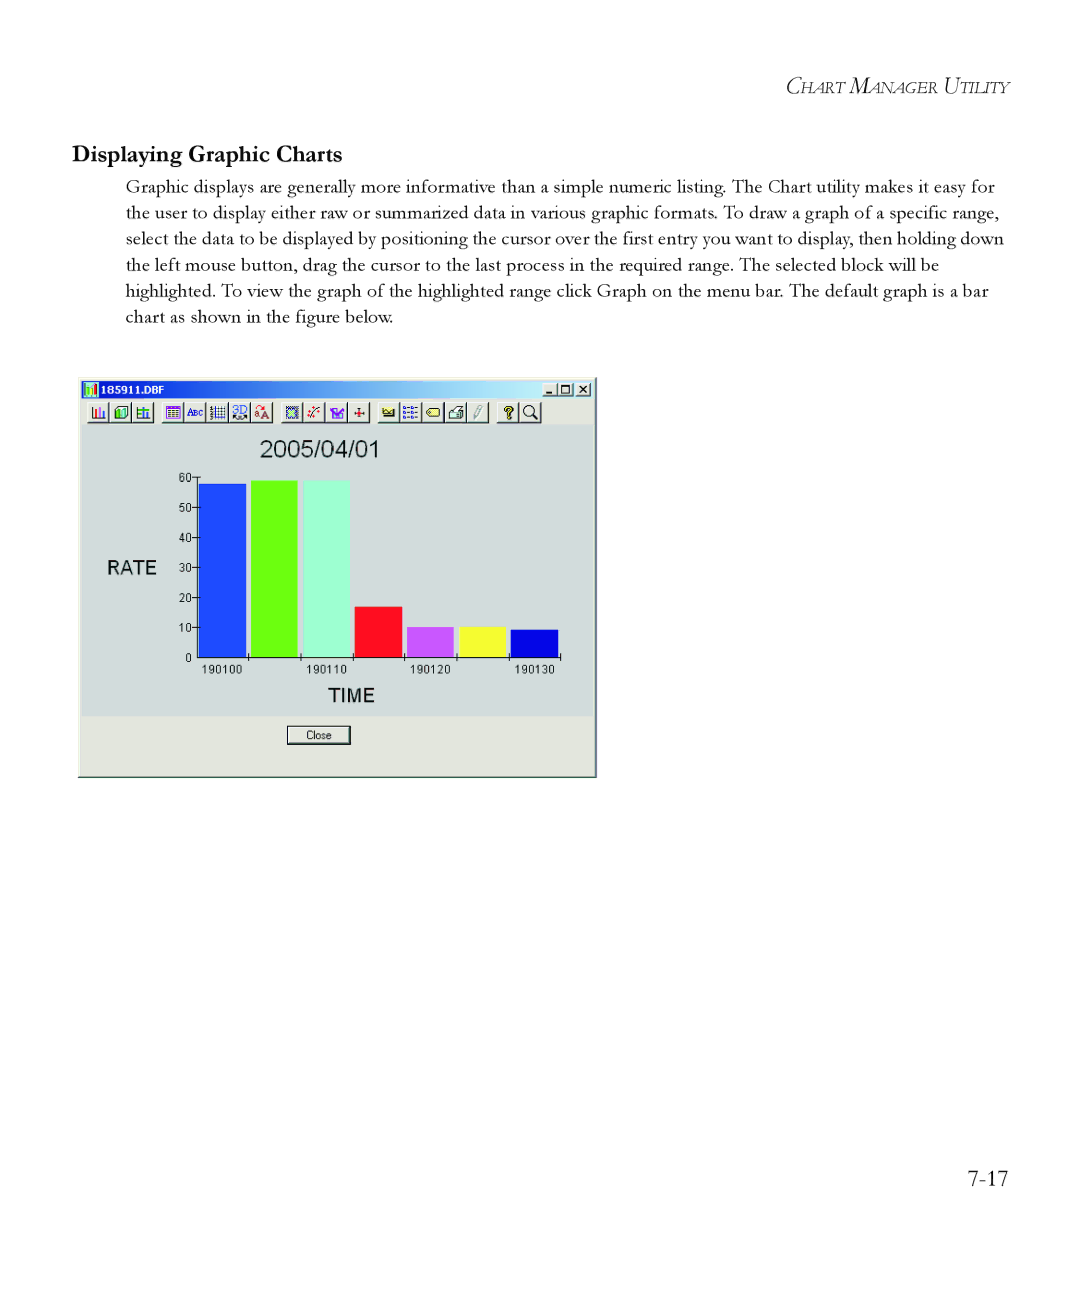
Graphic displays are generally more informative than a simple numeric listing. The Chart utility makes it easy for the user to display either raw or summarized data in various graphic formats. To draw a graph of a specific range, select the data to be displayed by positioning the cursor over the first entry you want to display, then holding down the left mouse button, drag the cursor to the last process in the required range. The selected block will be highlighted. To view the graph of the highlighted range click Graph on the menu bar. The default graph is a bar chart as shown in the figure below.