RMON UTILITIES
Statistics Group
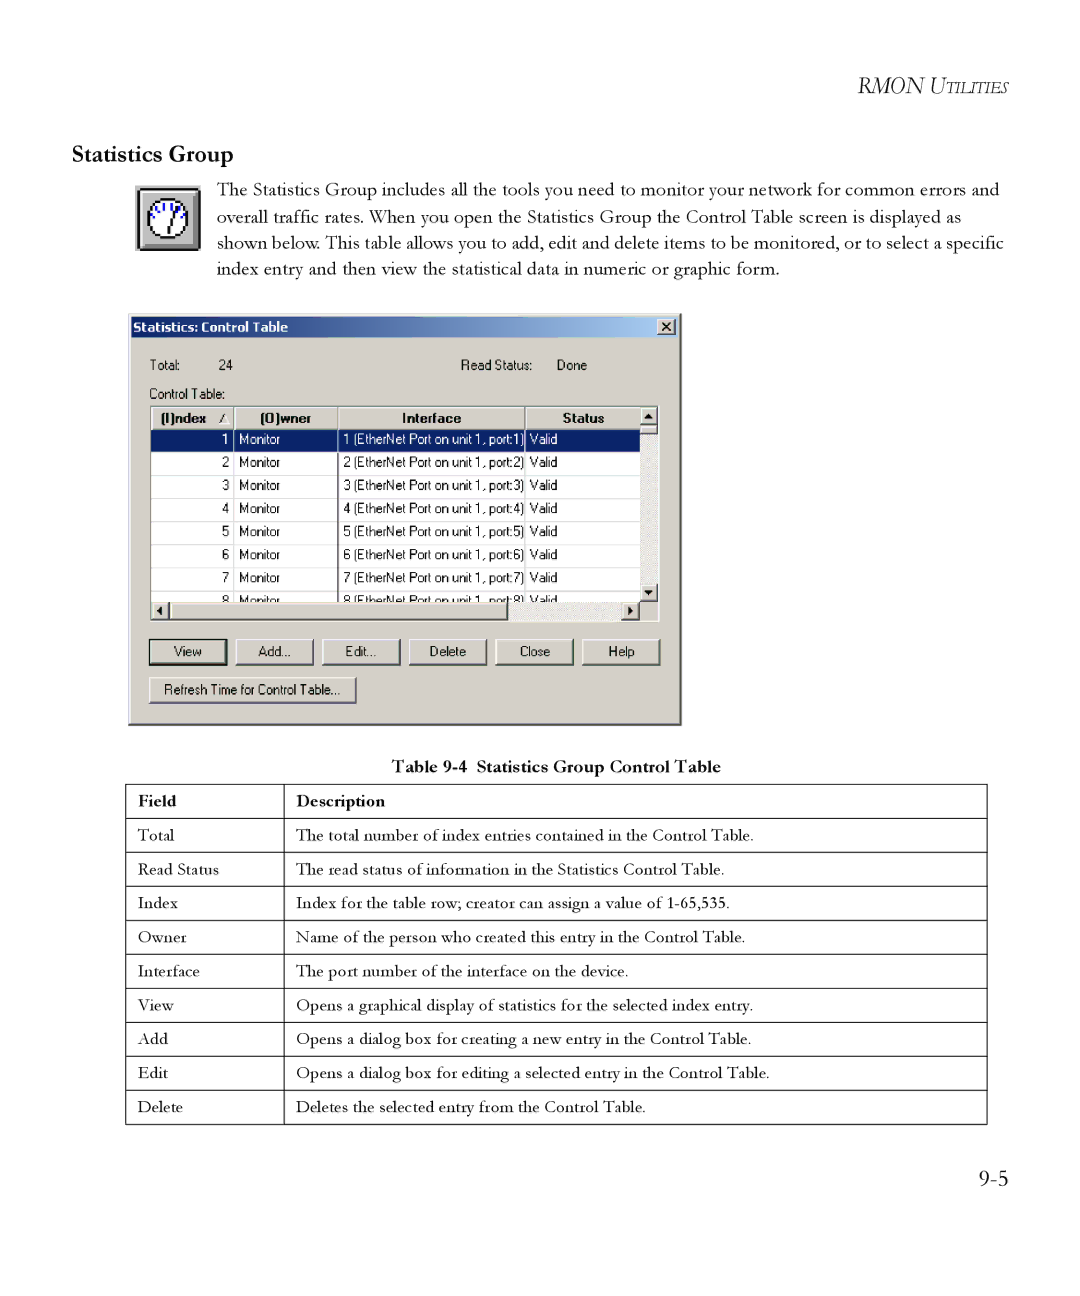
The Statistics Group includes all the tools you need to monitor your network for common errors and overall traffic rates. When you open the Statistics Group the Control Table screen is displayed as shown below. This table allows you to add, edit and delete items to be monitored, or to select a specific index entry and then view the statistical data in numeric or graphic form.
| Table |
|
|
Field | Description |
|
|
Total | The total number of index entries contained in the Control Table. |
|
|
Read Status | The read status of information in the Statistics Control Table. |
|
|
Index | Index for the table row; creator can assign a value of |
|
|
Owner | Name of the person who created this entry in the Control Table. |
|
|
Interface | The port number of the interface on the device. |
|
|
View | Opens a graphical display of statistics for the selected index entry. |
|
|
Add | Opens a dialog box for creating a new entry in the Control Table. |
|
|
Edit | Opens a dialog box for editing a selected entry in the Control Table. |
|
|
Delete | Deletes the selected entry from the Control Table. |
|
|
