|
| RMON UTILITIES |
|
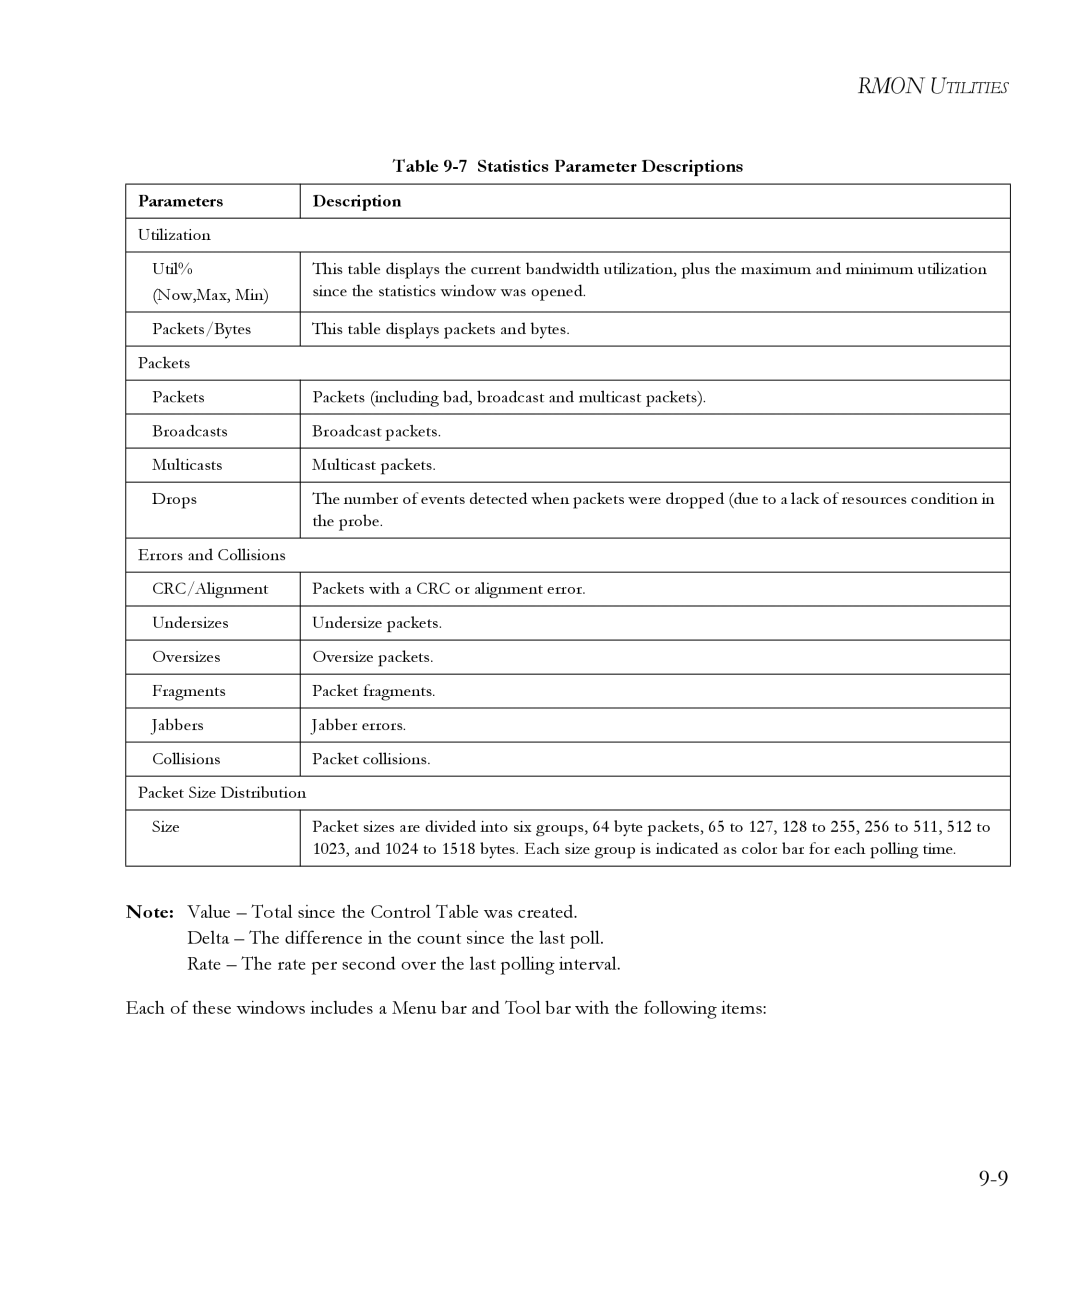
| Table |
|
| |
Parameters |
| Description |
|
|
|
Utilization |
| |
|
| |
Util% |
| This table displays the current bandwidth utilization, plus the maximum and minimum utilization |
(Now,Max, Min) |
| since the statistics window was opened. |
|
|
|
Packets/Bytes |
| This table displays packets and bytes. |
|
|
|
Packets |
| |
|
| |
Packets |
| Packets (including bad, broadcast and multicast packets). |
|
|
|
Broadcasts |
| Broadcast packets. |
|
|
|
Multicasts |
| Multicast packets. |
|
|
|
Drops |
| The number of events detected when packets were dropped (due to a lack of resources condition in |
|
| the probe. |
|
|
|
Errors and Collisions |
| |
|
| |
CRC/Alignment |
| Packets with a CRC or alignment error. |
|
|
|
Undersizes |
| Undersize packets. |
|
|
|
Oversizes |
| Oversize packets. |
|
|
|
Fragments |
| Packet fragments. |
|
|
|
Jabbers |
| Jabber errors. |
|
|
|
Collisions |
| Packet collisions. |
|
|
|
Packet Size Distribution |
| |
|
| |
Size |
| Packet sizes are divided into six groups, 64 byte packets, 65 to 127, 128 to 255, 256 to 511, 512 to |
|
| 1023, and 1024 to 1518 bytes. Each size group is indicated as color bar for each polling time. |
|
|
|
Note: Value – Total since the Control Table was created.
Delta – The difference in the count since the last poll.
Rate – The rate per second over the last polling interval.
Each of these windows includes a Menu bar and Tool bar with the following items: